

Unit 1: Introduction
Explore the fundamentals of statistics and how to use Python for data analysis.
8 Modules:
- 1.1: Welcome
- 1.2: What is Data Analysis?
- 1.3: Python Refresher
- 1.4: Start Your Analysis
- 1.5: Back to Python
- 1.6: Review
- 1.7: Quiz
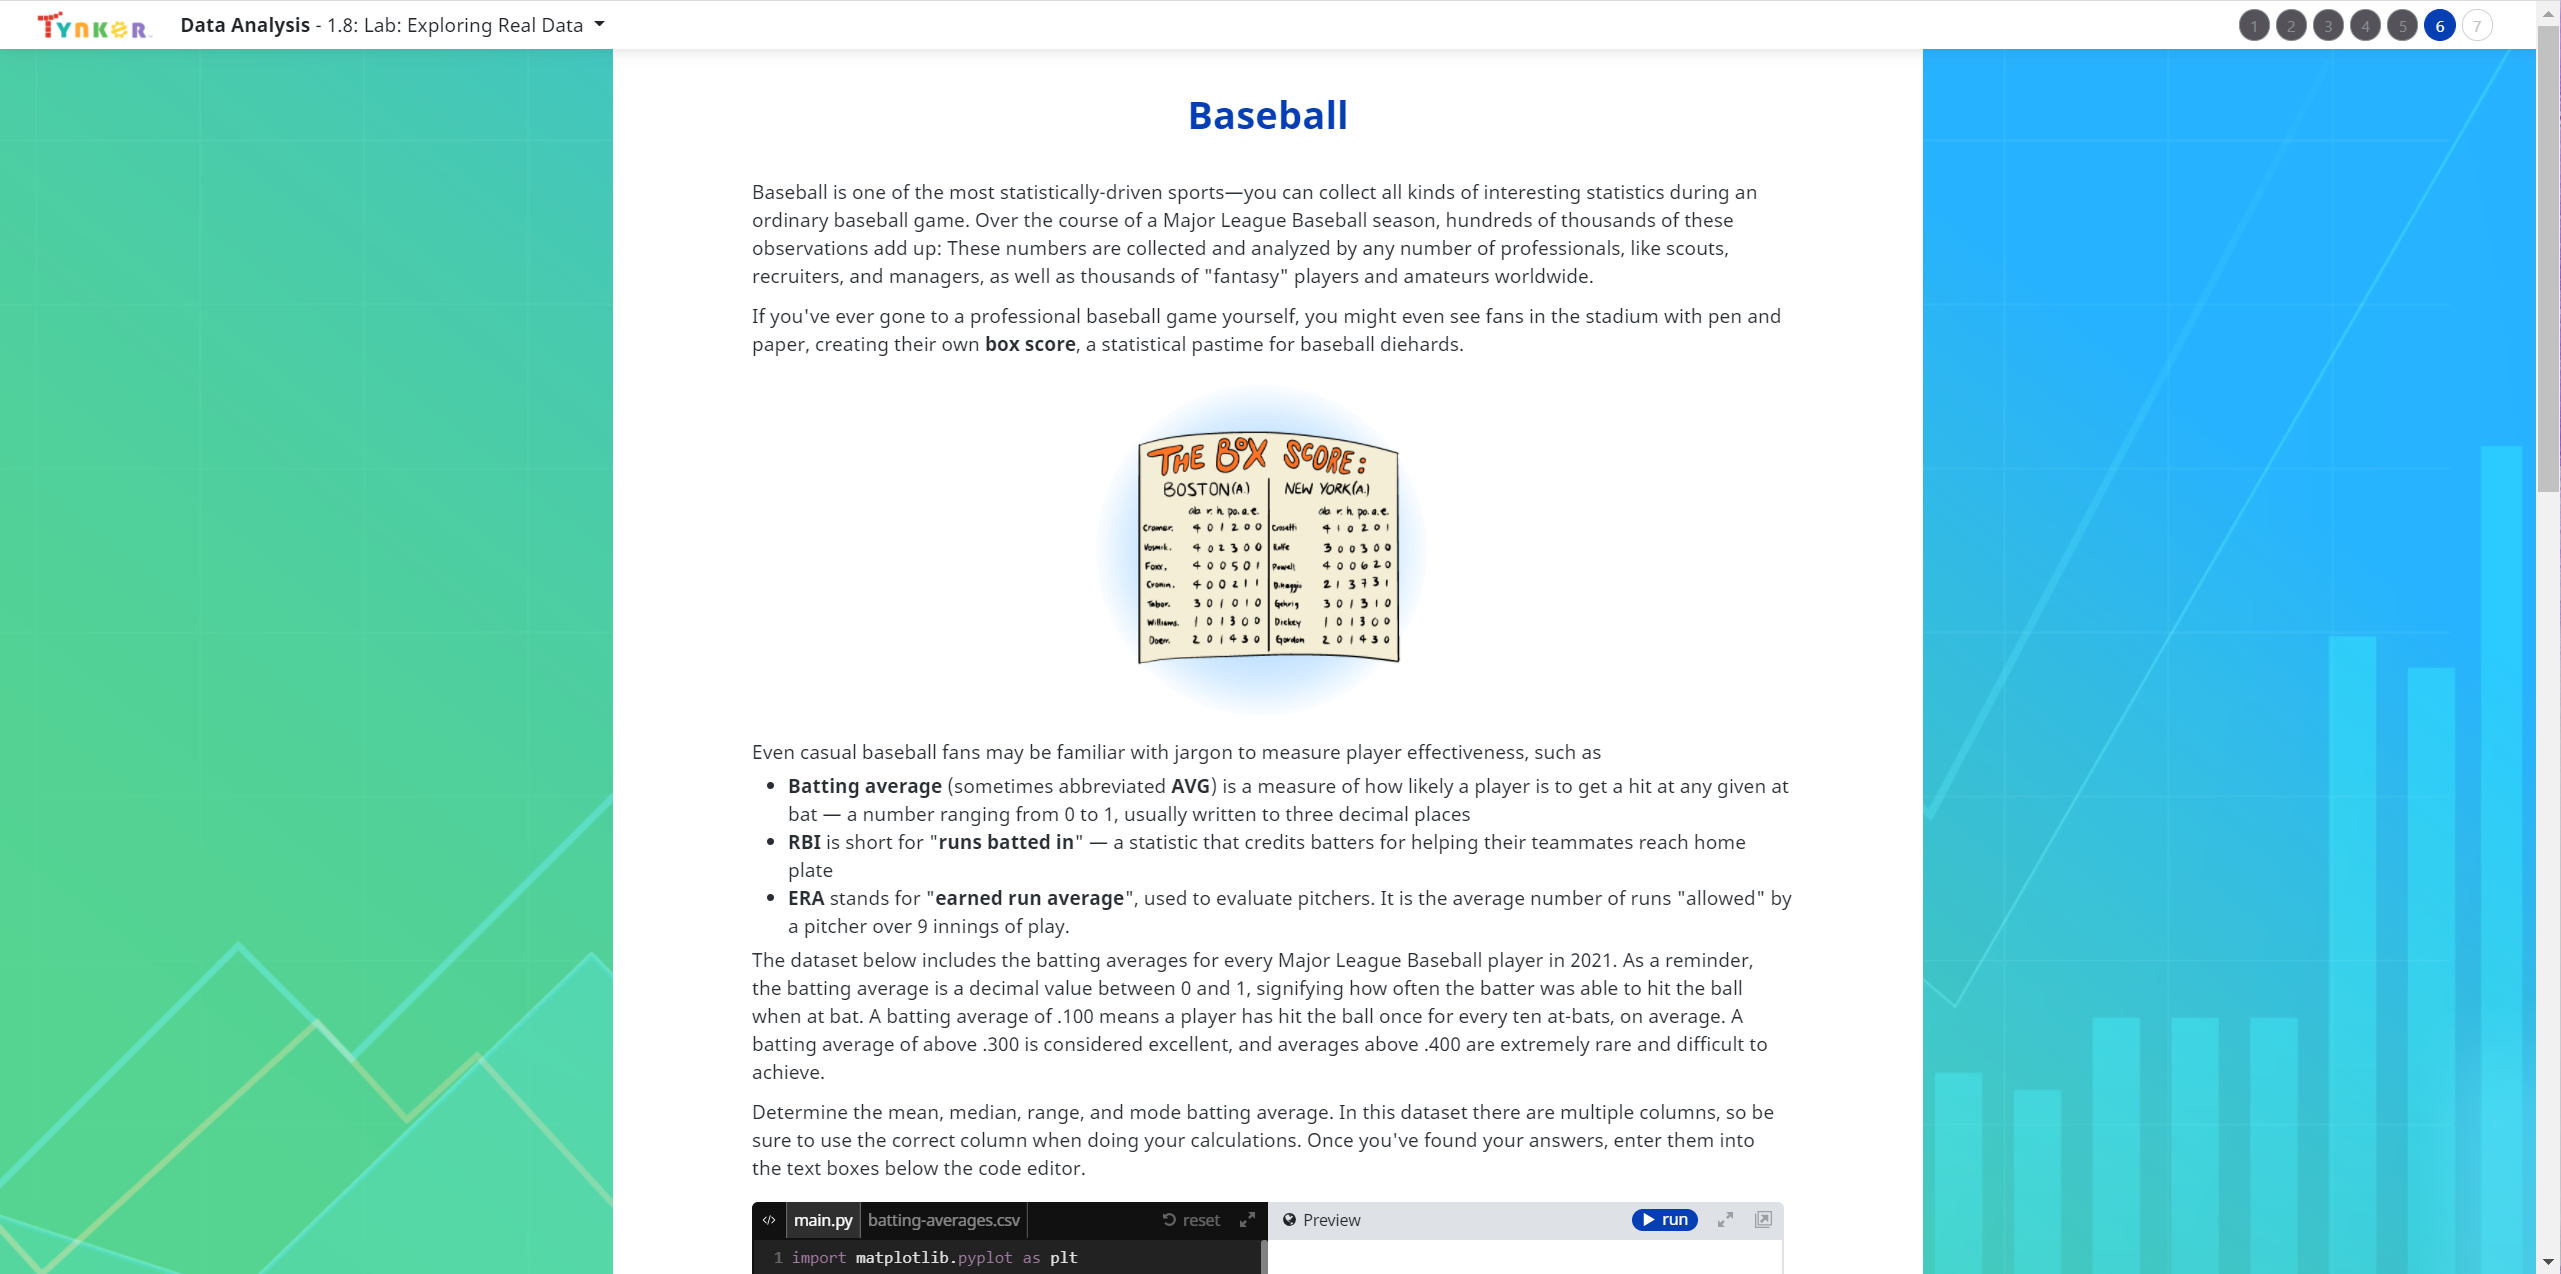
- 1.8: Lab: Exploring Real Data
Unit 2: Graphs
Create basic graphs with matplotlib: Line charts, bar charts, histograms, and more.
7 Modules:
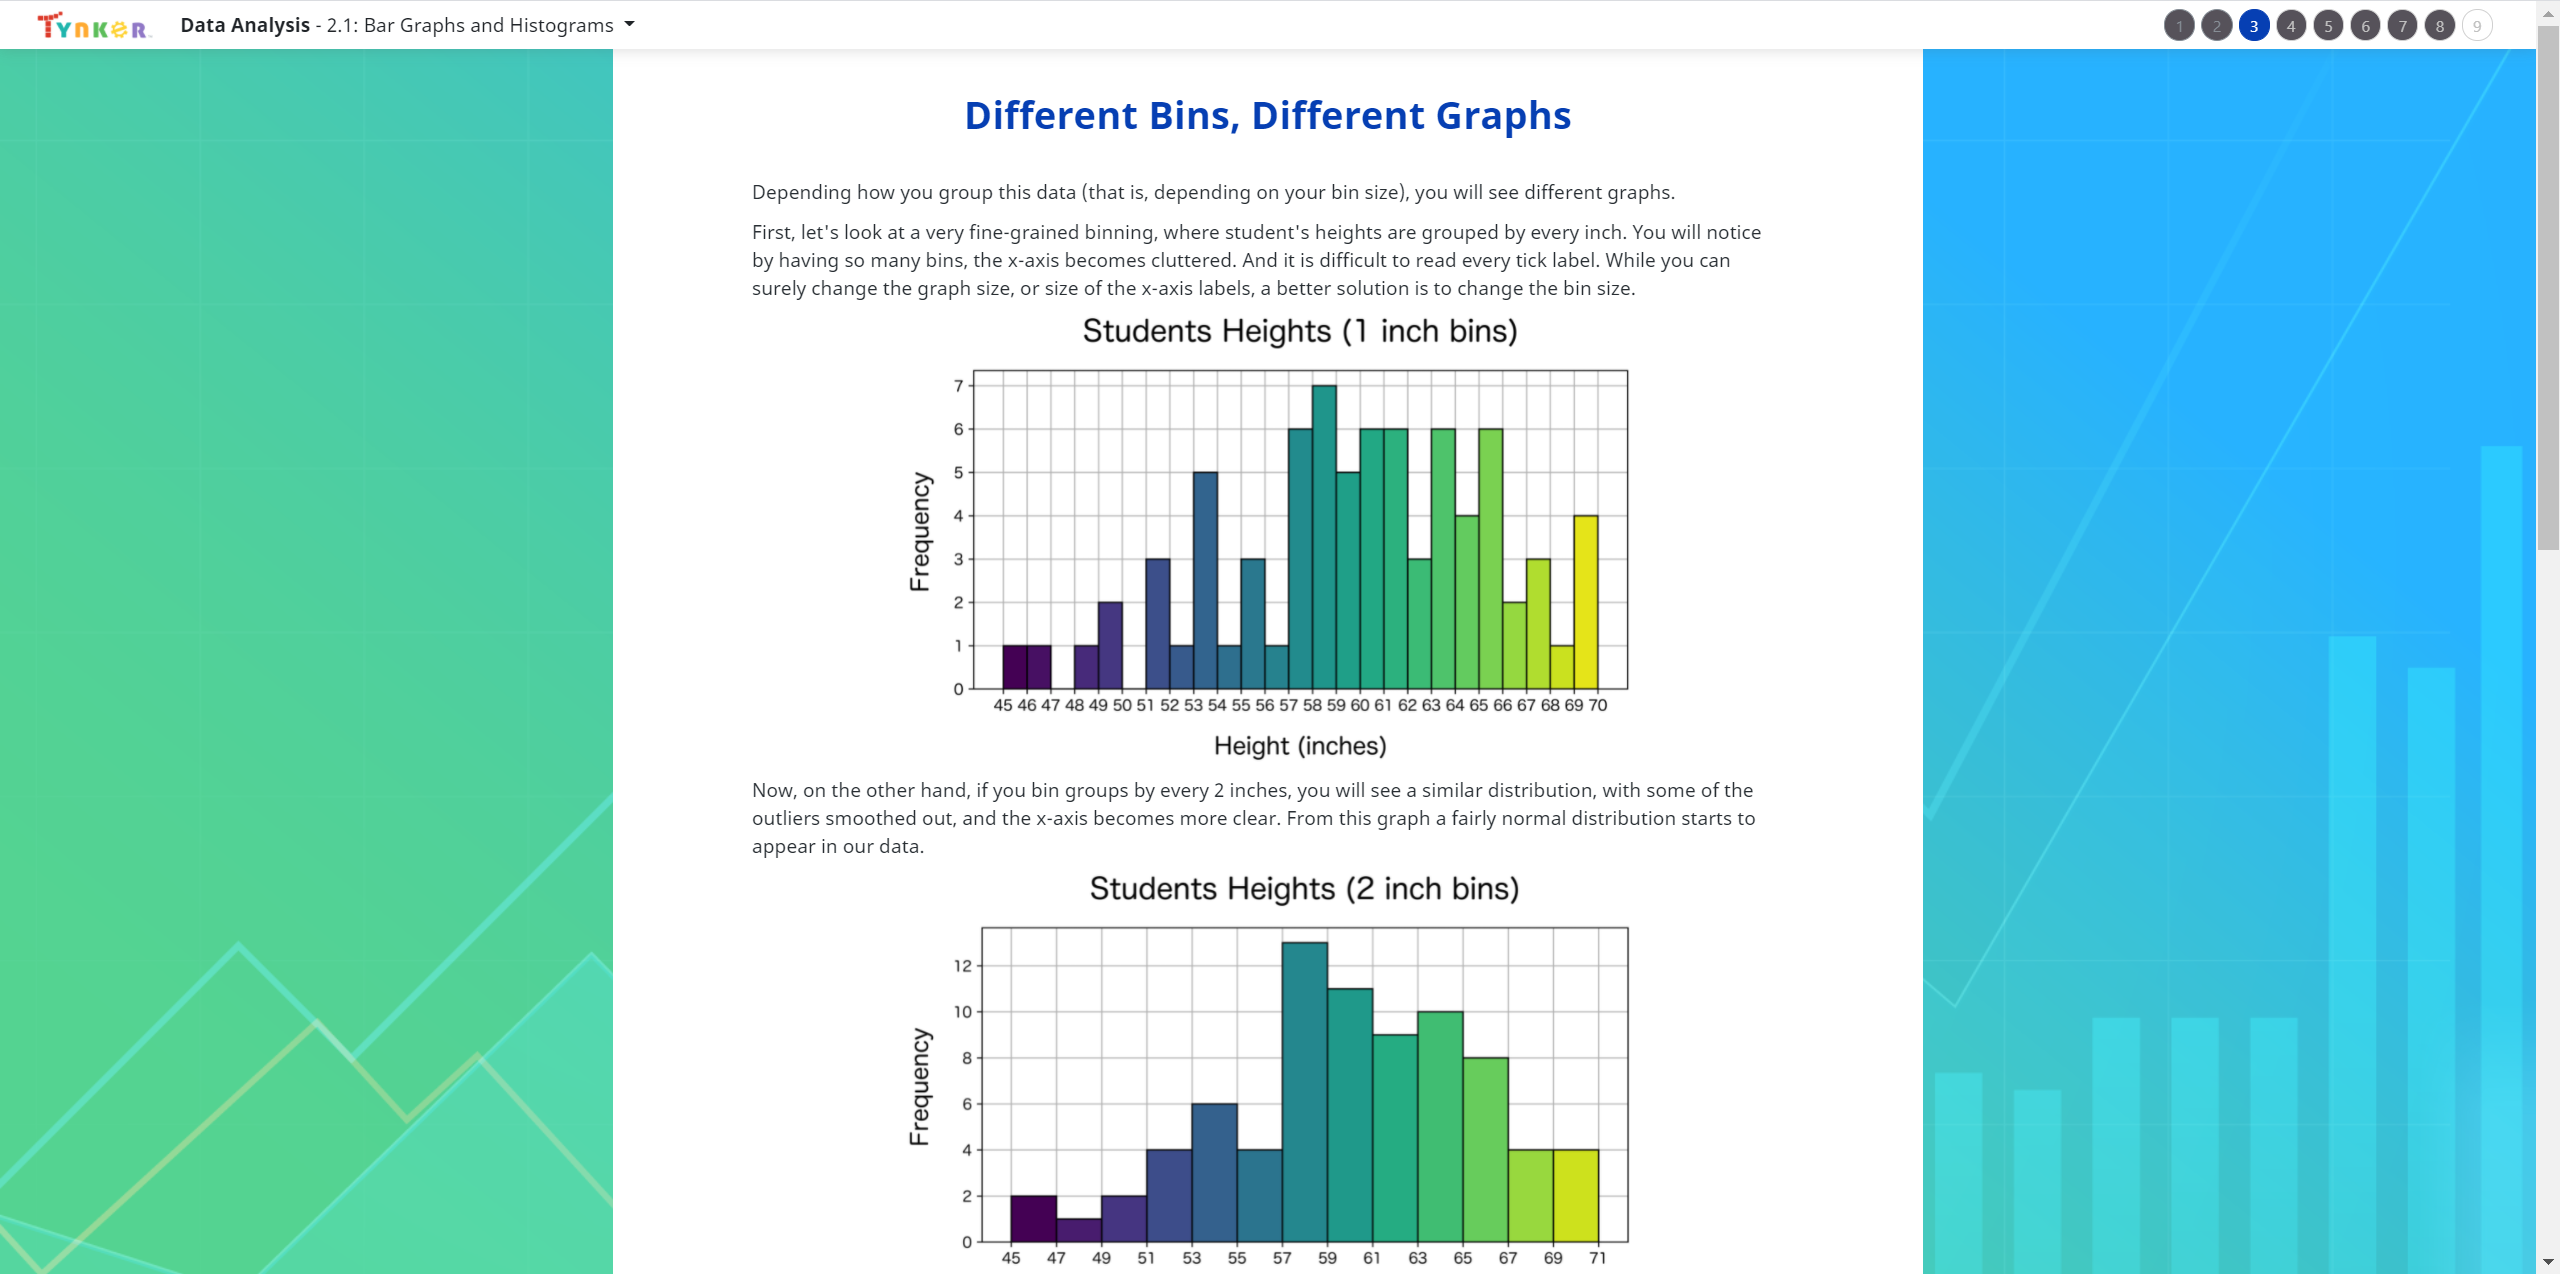
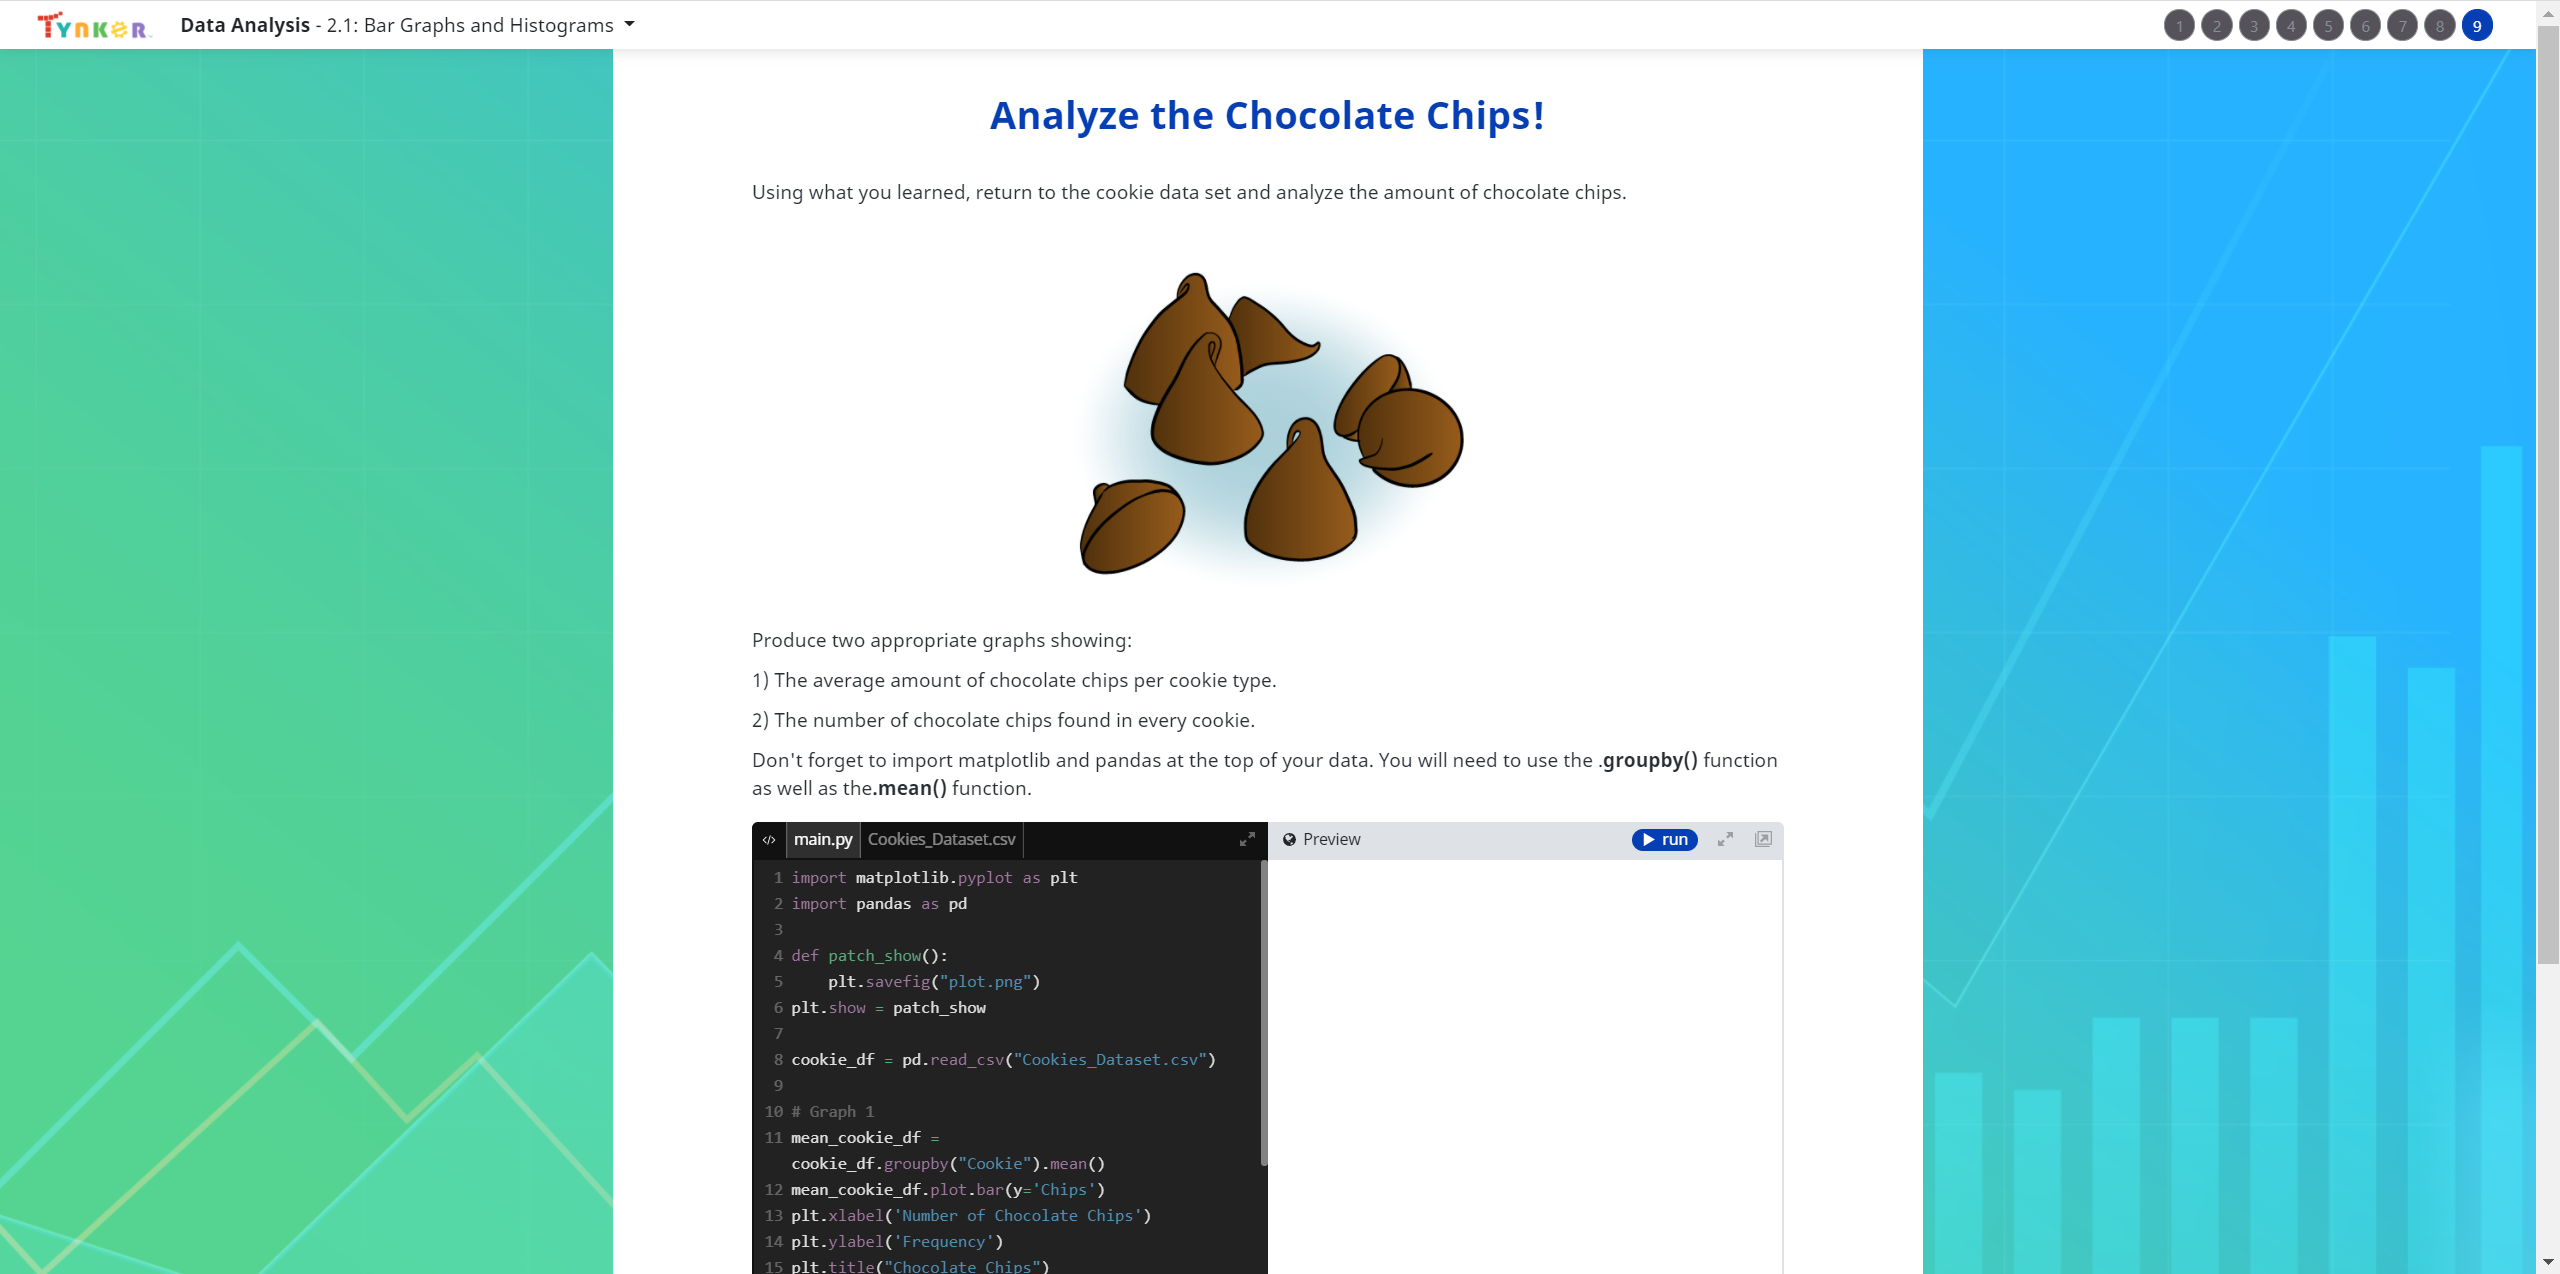
- 2.1: Bar Graphs and Histograms
- 2.2: Line Graphs
- 2.3: Scatter Plots
- 2.4: Customizing Plots
- 2.5: Review
- 2.6: Quiz
- 2.7: Lab: Rainfall
Unit 3: DataFrames
Manipulate your datasets using DataFrames, a data type in pandas.
7 Modules:
- 3.1: Creating Dataframes
- 3.2: Creating Random Data
- 3.3: Manipulating Data Sets
- 3.4: Variation of a Normal Curve
- 3.5: Review
- 3.6: Quiz
- 3.7 Lab: Olympics Medals
Unit 4: Complex Charts
Learn about advanced chart types, and explore how to customize your figures.
9 Modules:
- 4.1: Box Plots
- 4.2: Area Plots
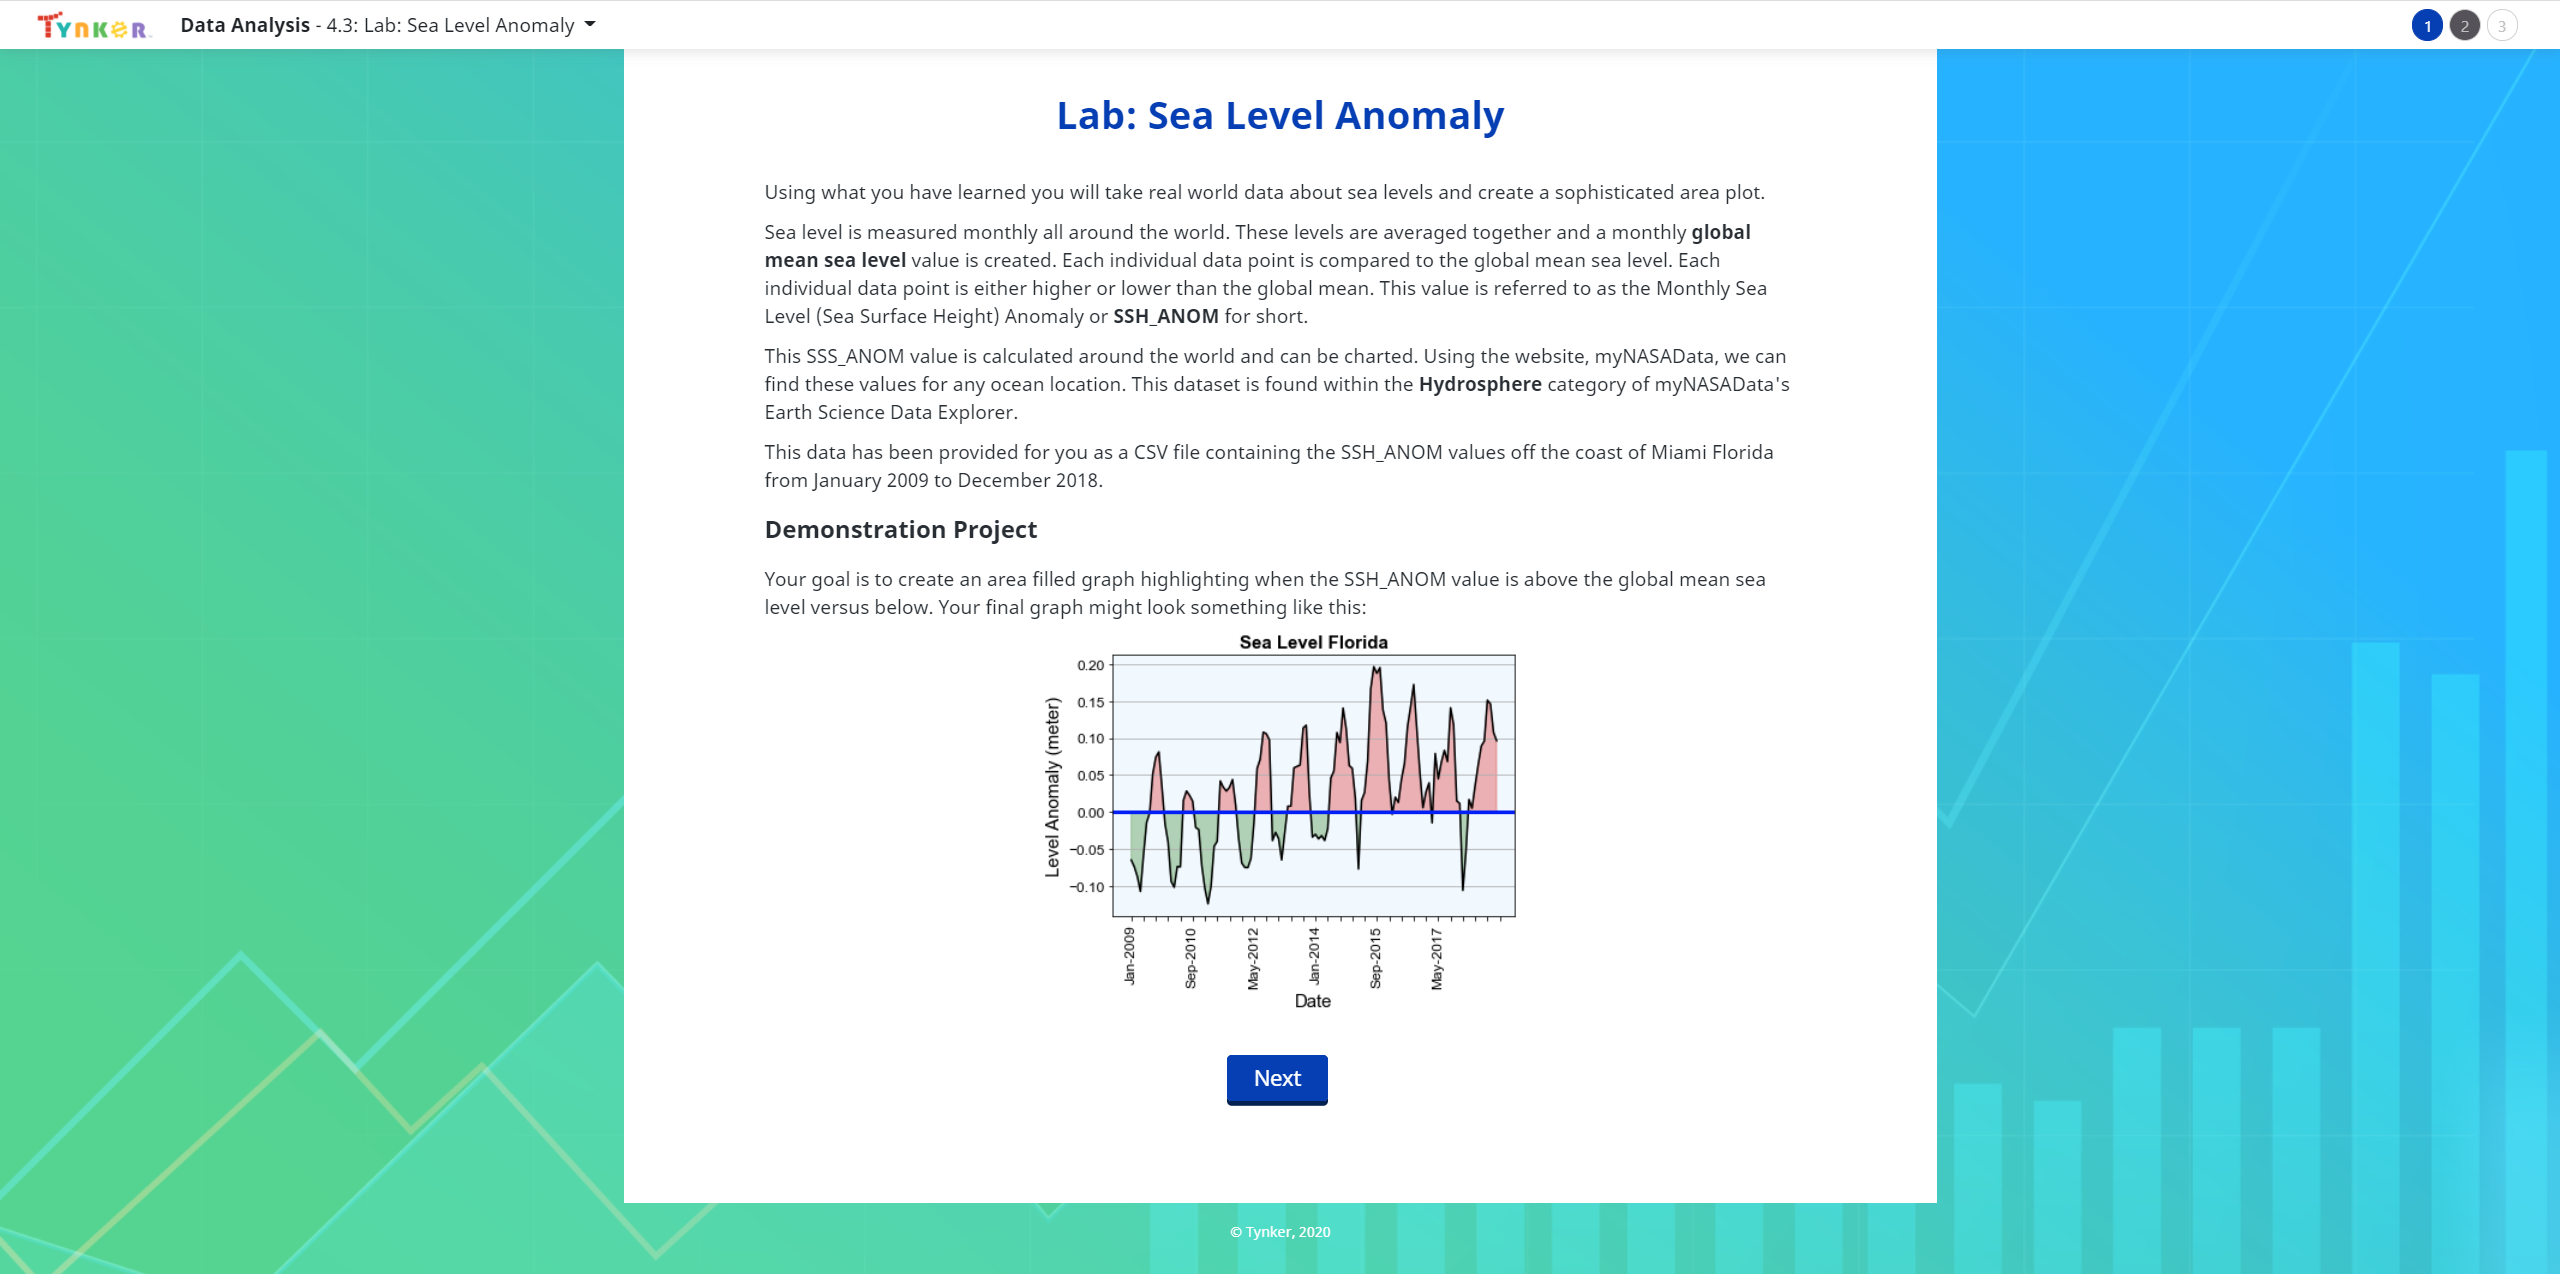
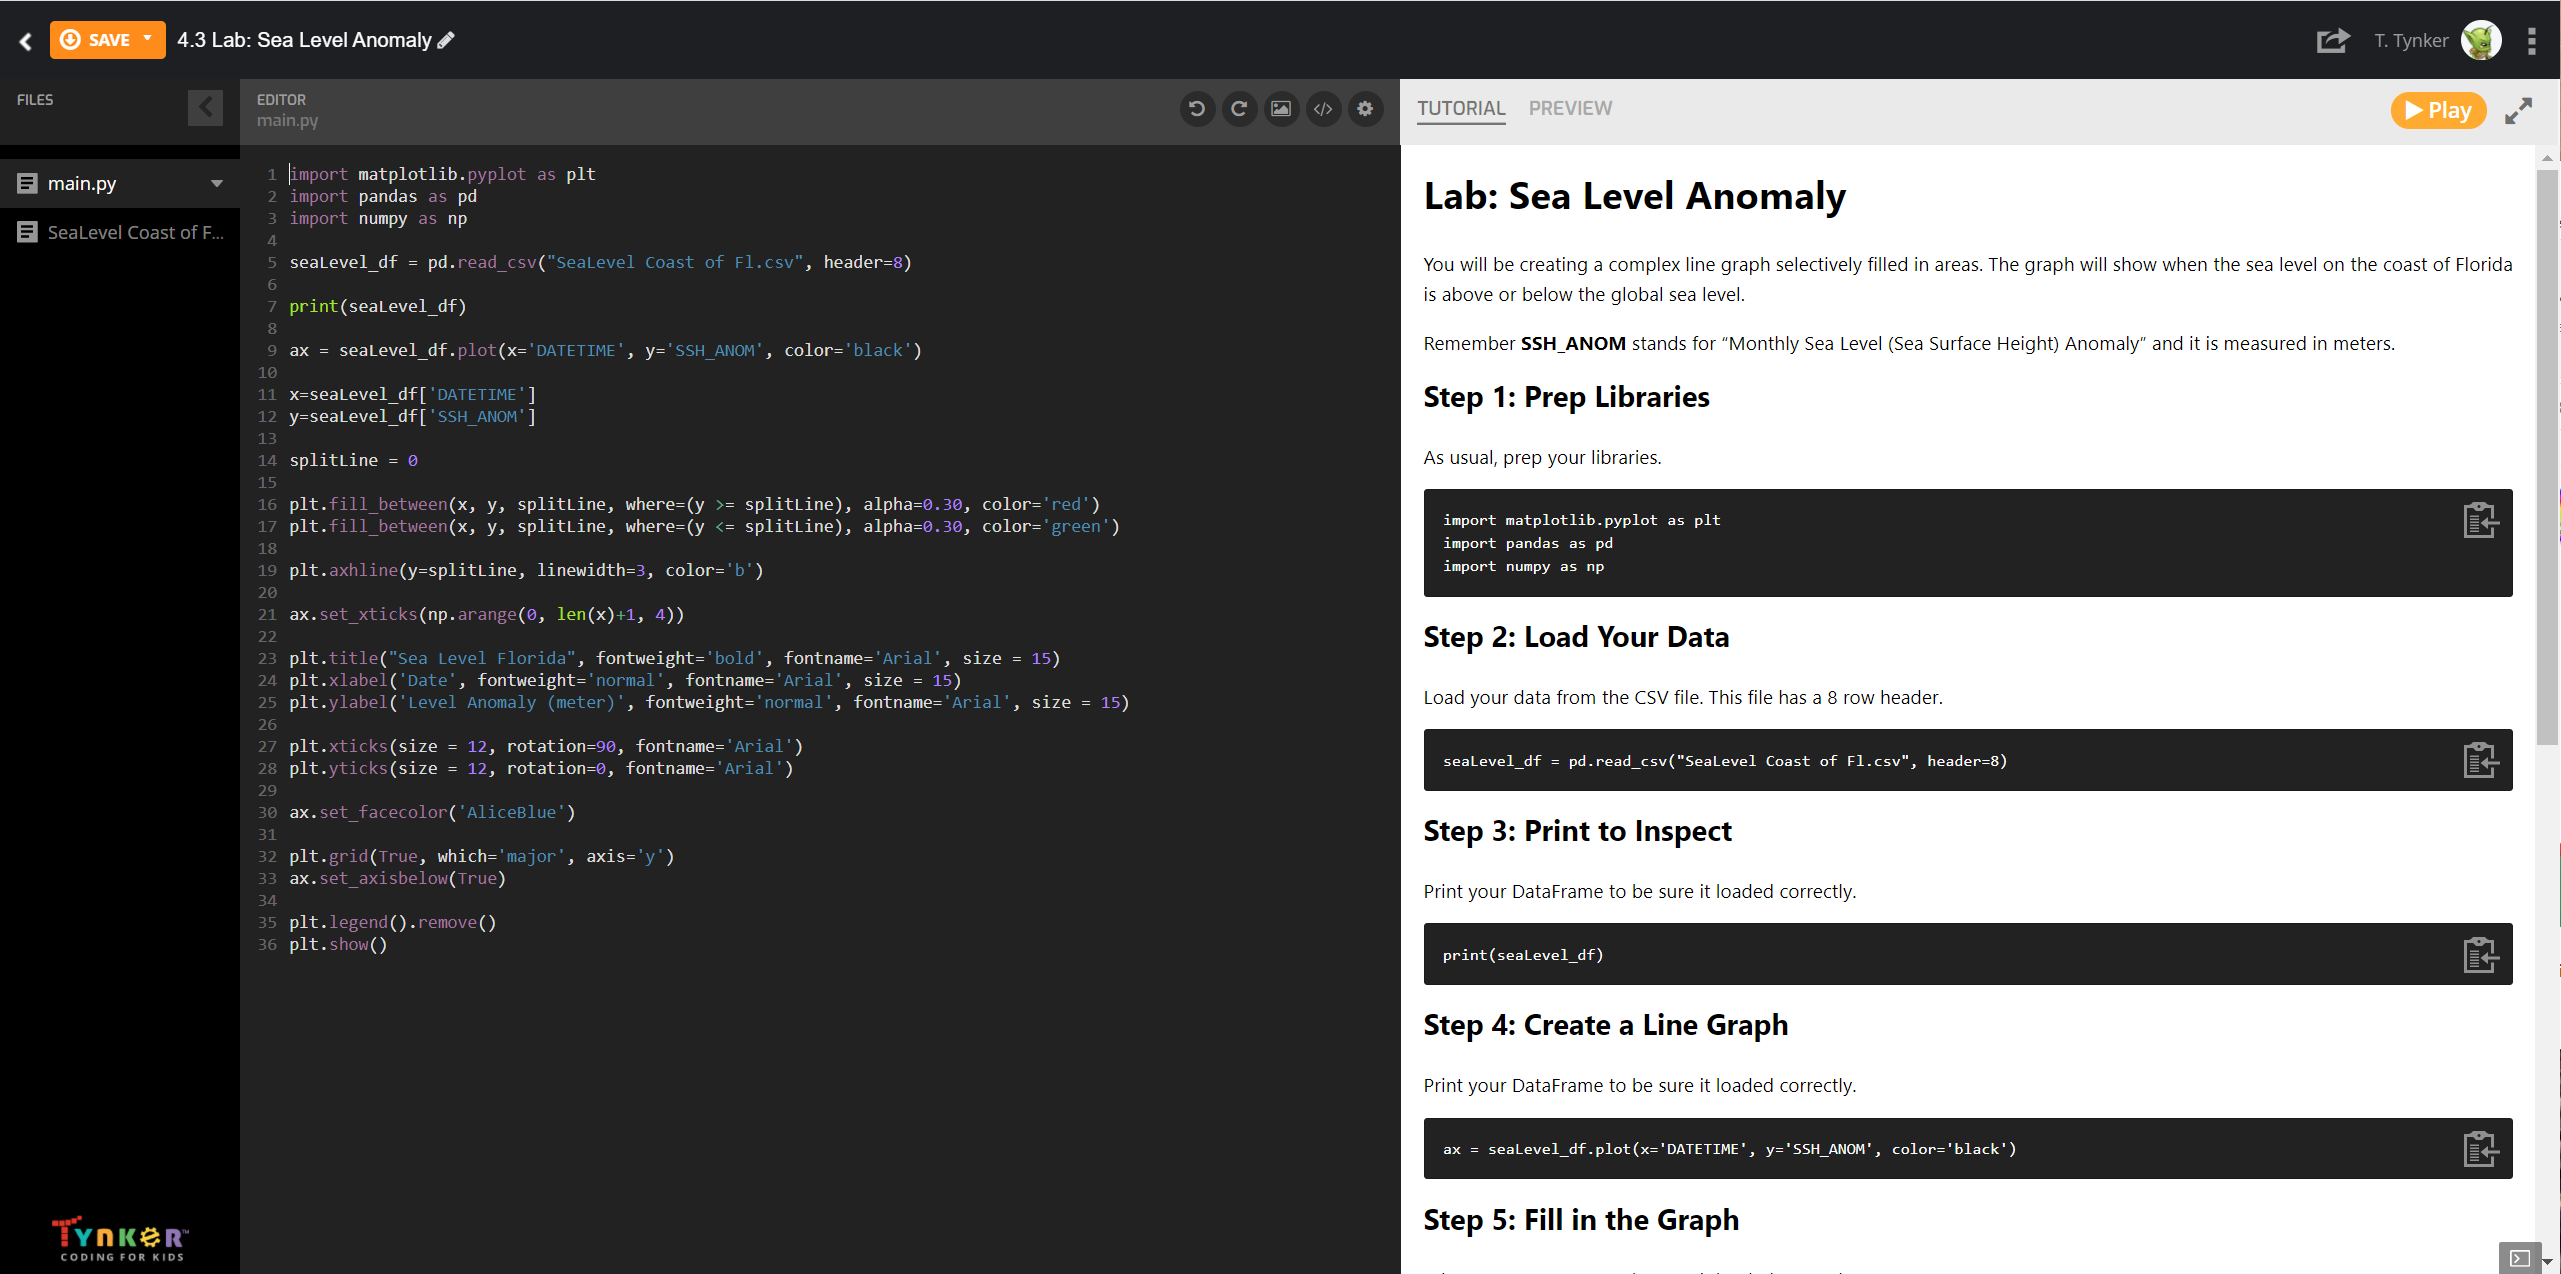
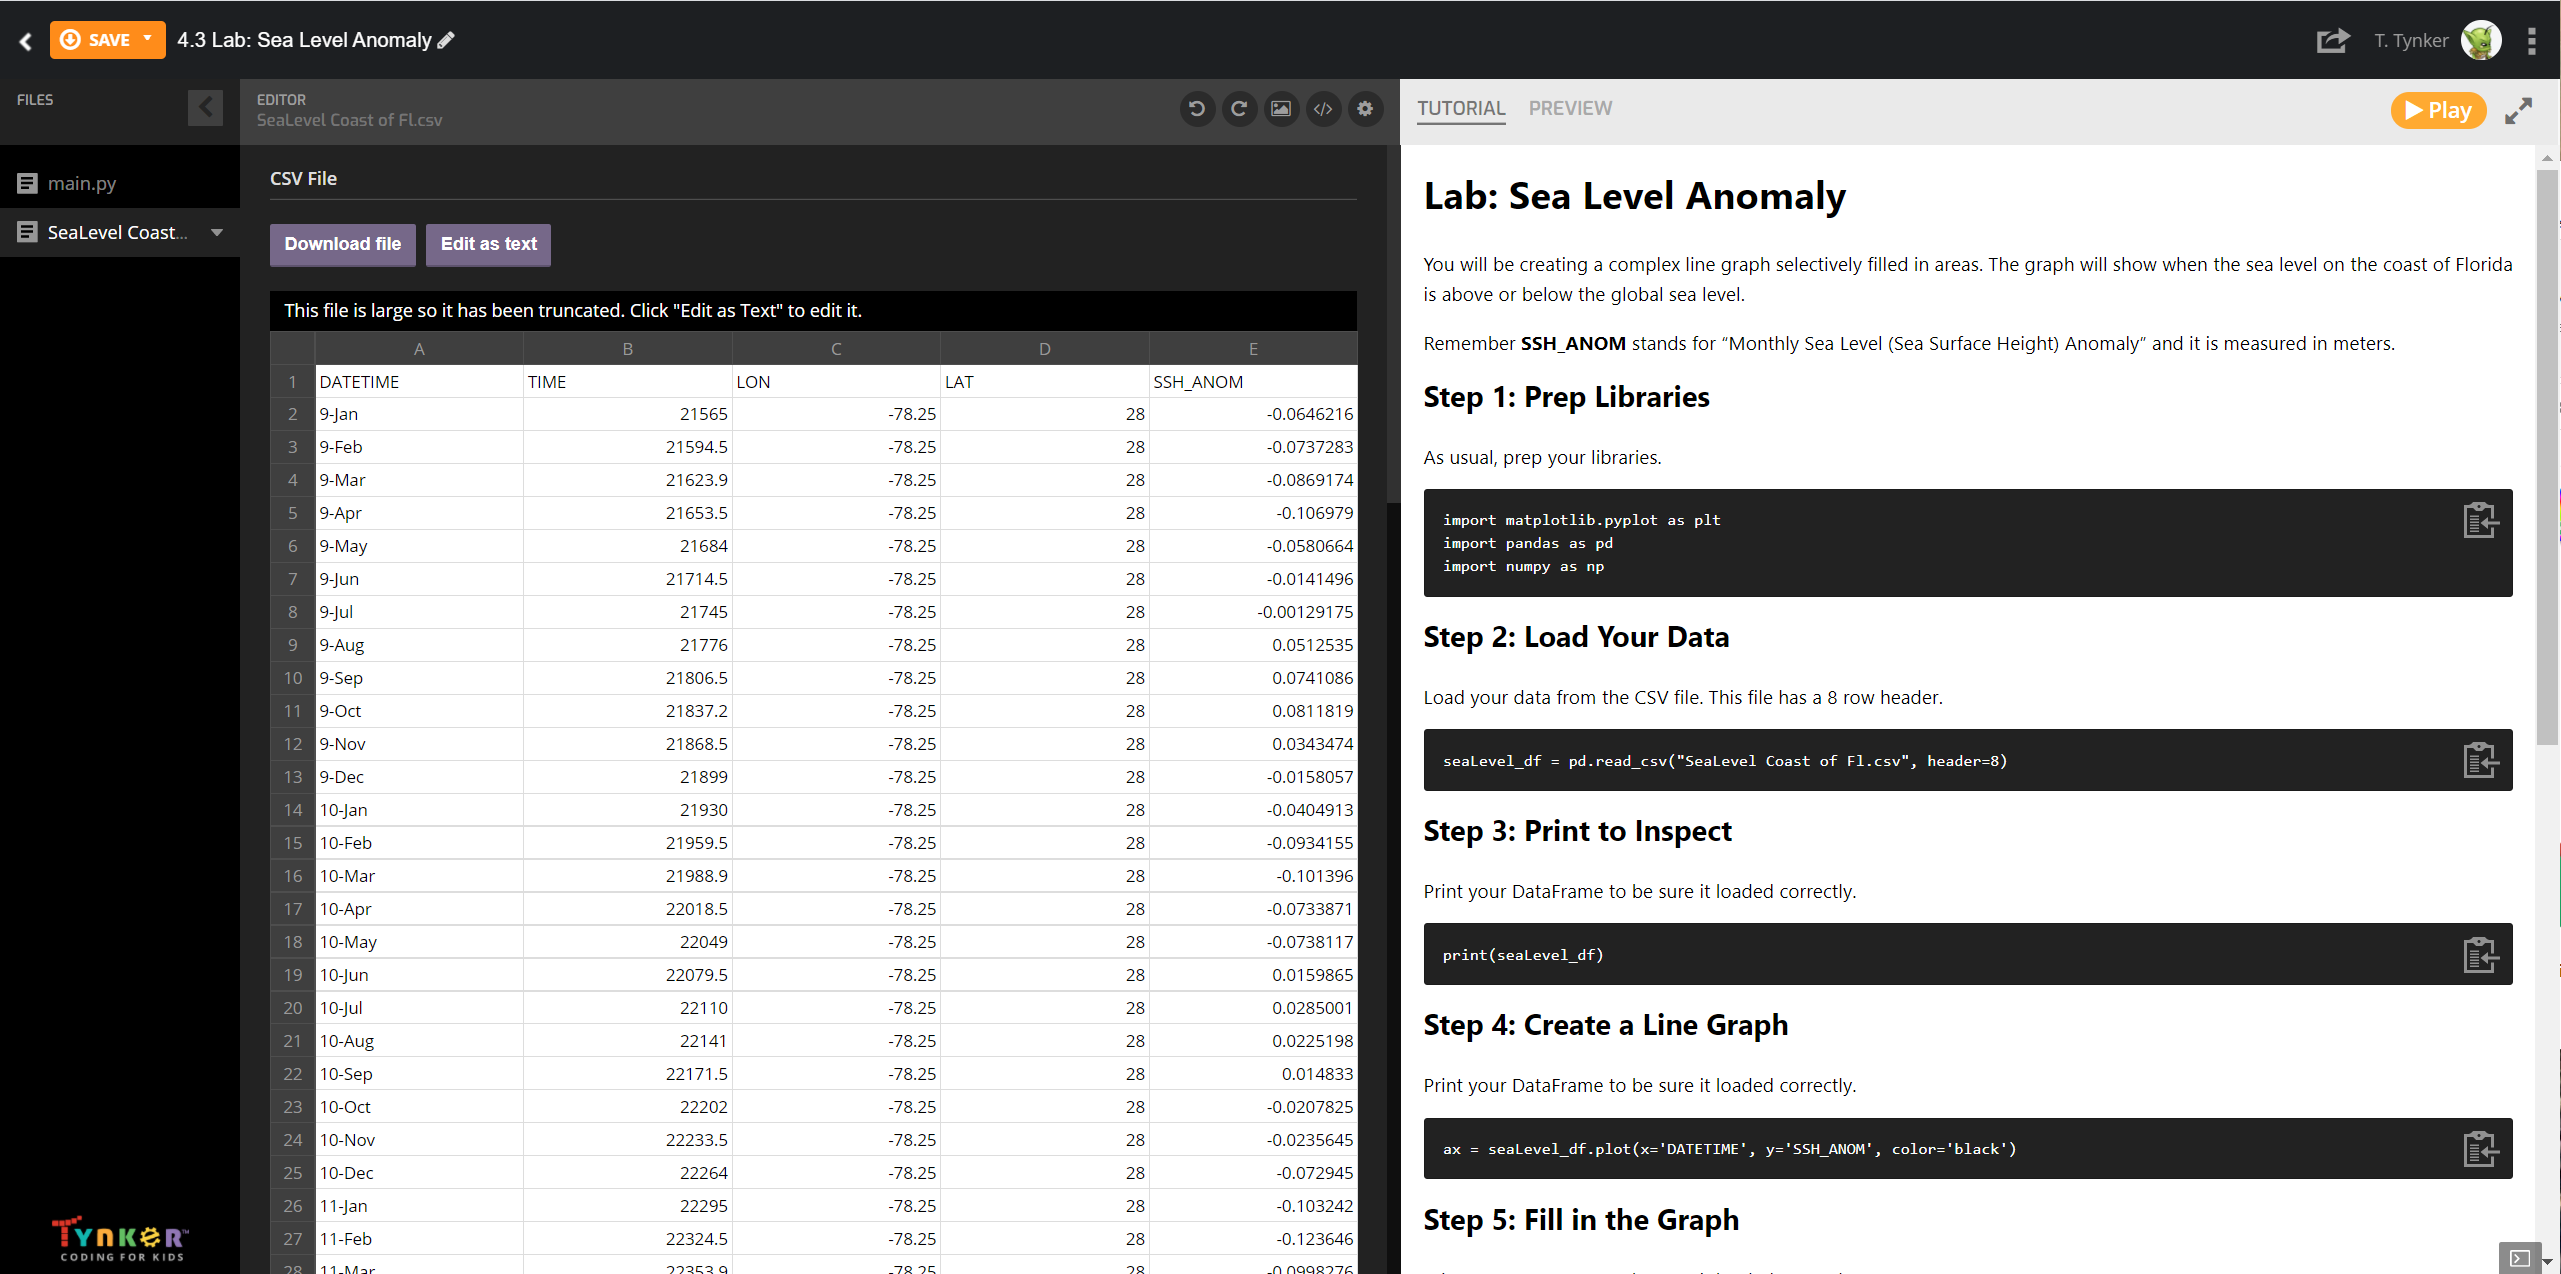
- 4.3: Lab: Sea Level Anomaly
- 4.4: Creating Figures
- 4.5: Customizing Figures
- 4.6: Complex Bar Graphs
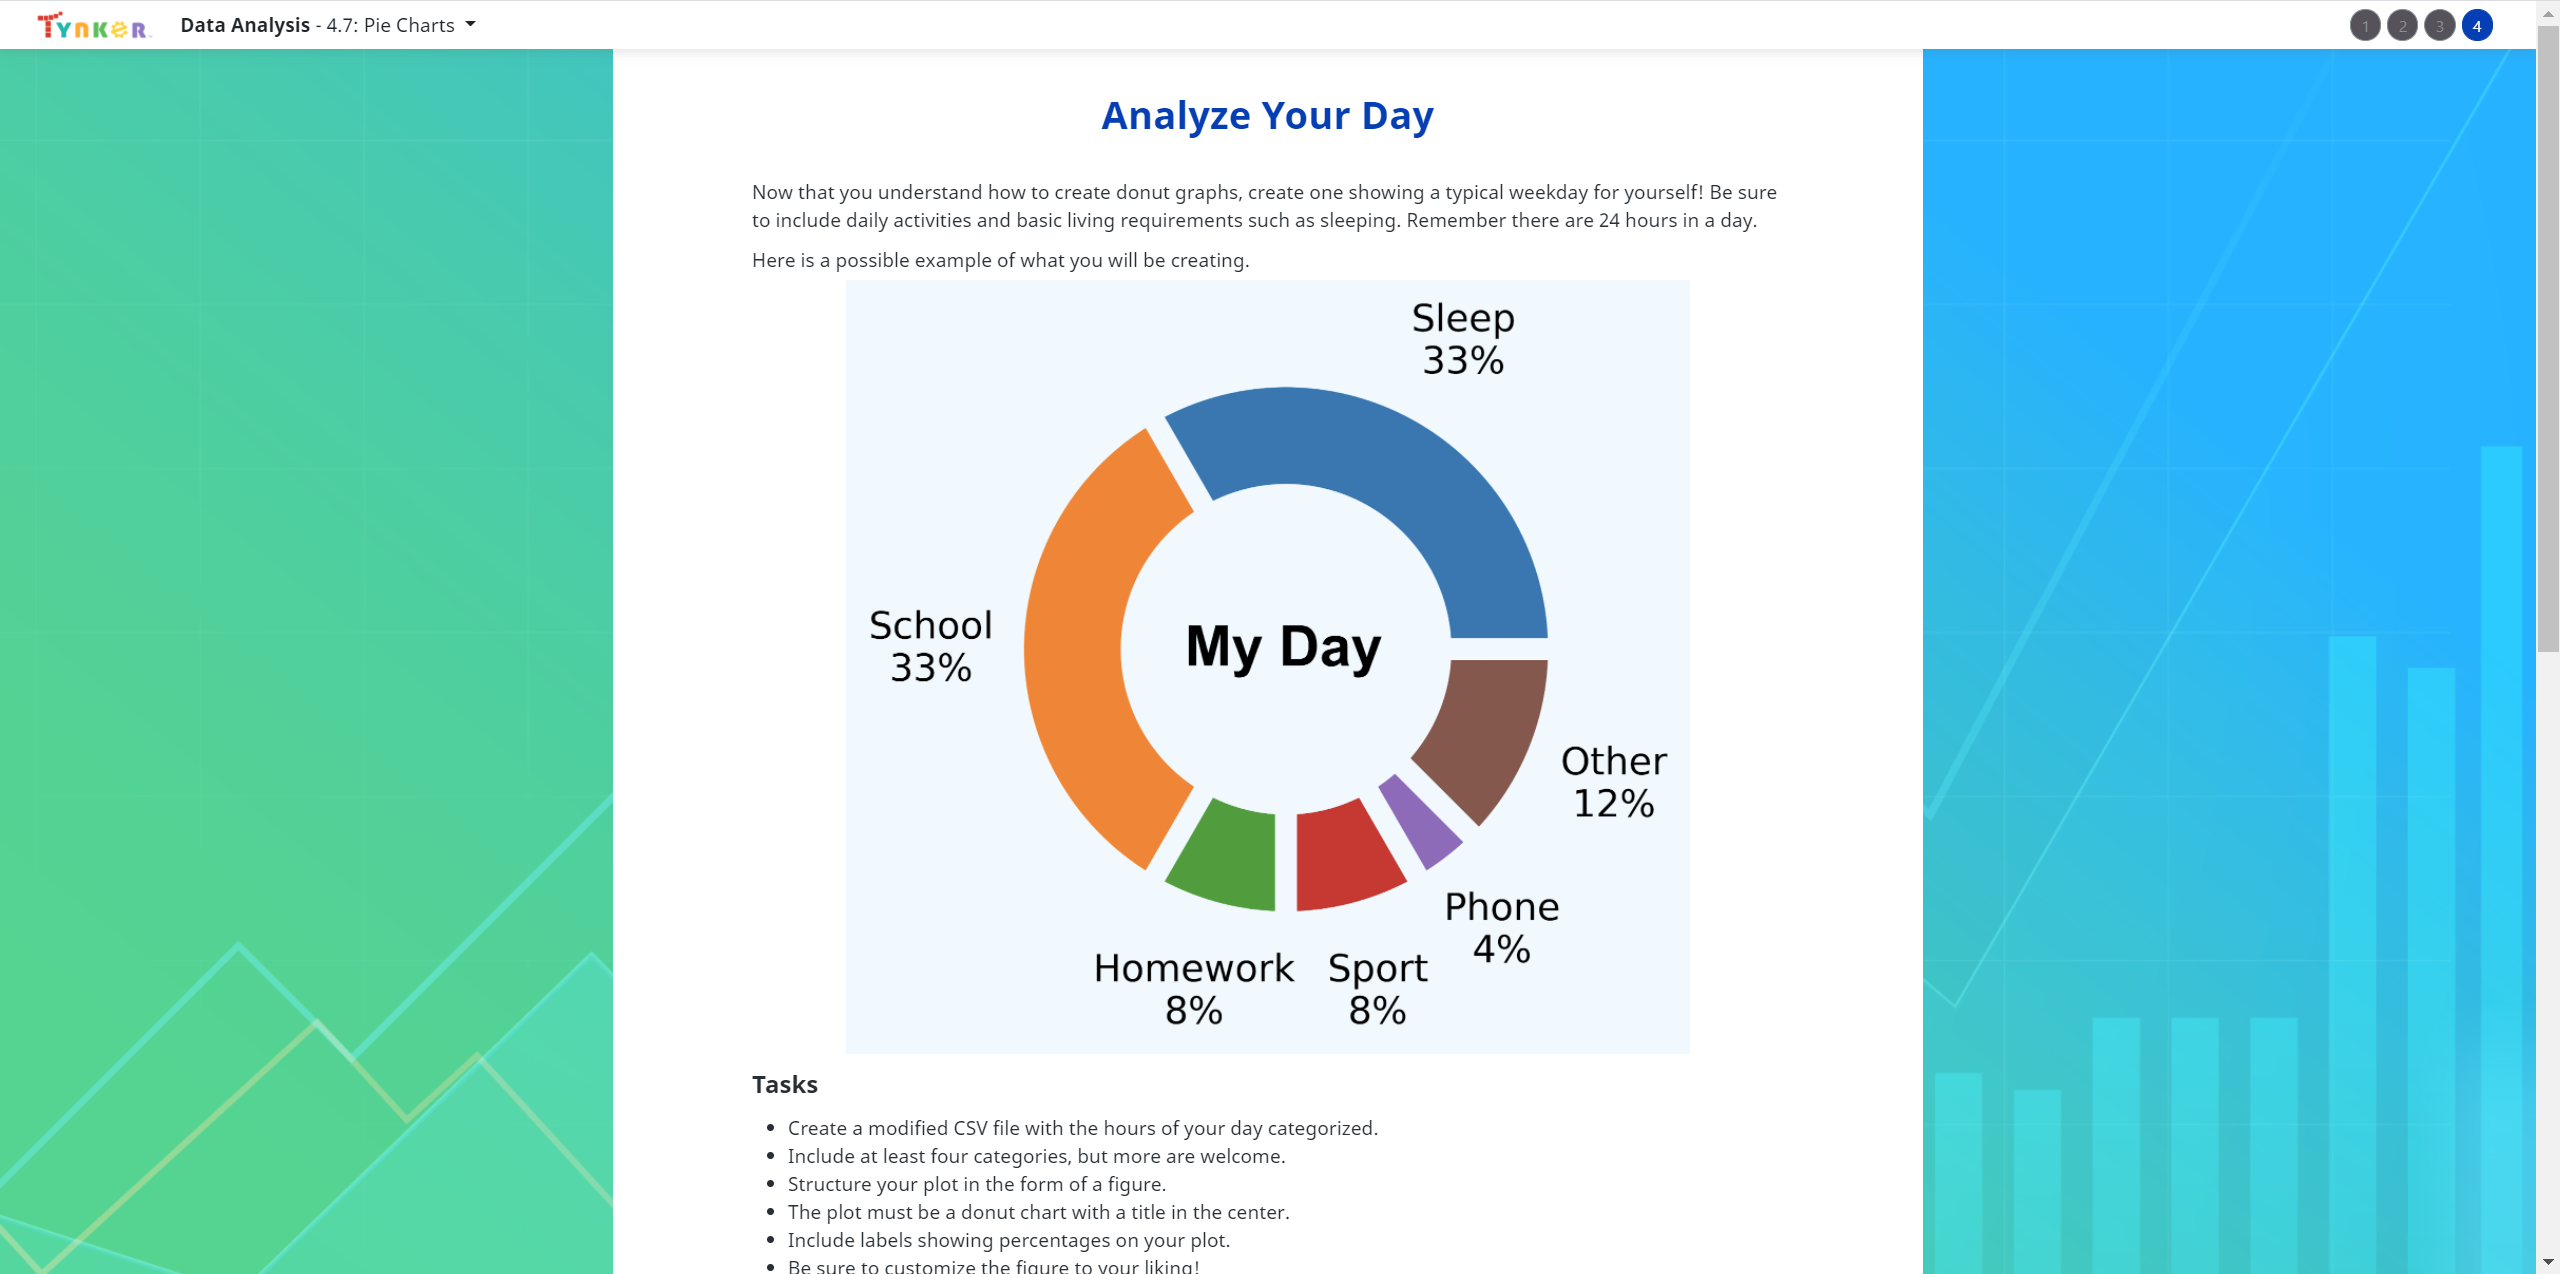
- 4.7: Pie Charts
- 4.8: Review
- 4.9: Quiz
Unit 5: Capstone Project
Put your data skills to the test in this open-ended coding challenge.
5 Modules:
- 5.1 Day 1: Intro to Final Lab
- 5.2 Day 2: Load Data, Initial Charts
- 5.3 Day 3: Charts Complete
- 5.4 Day 4: Polish, Customize, Document
- 5.5 Day 5: Final Report