Answer Key
No answer keys for this section.
Standards
No standards for this section.
Description
Explore data in areas such as science, sports, politics, climate change, and much more!
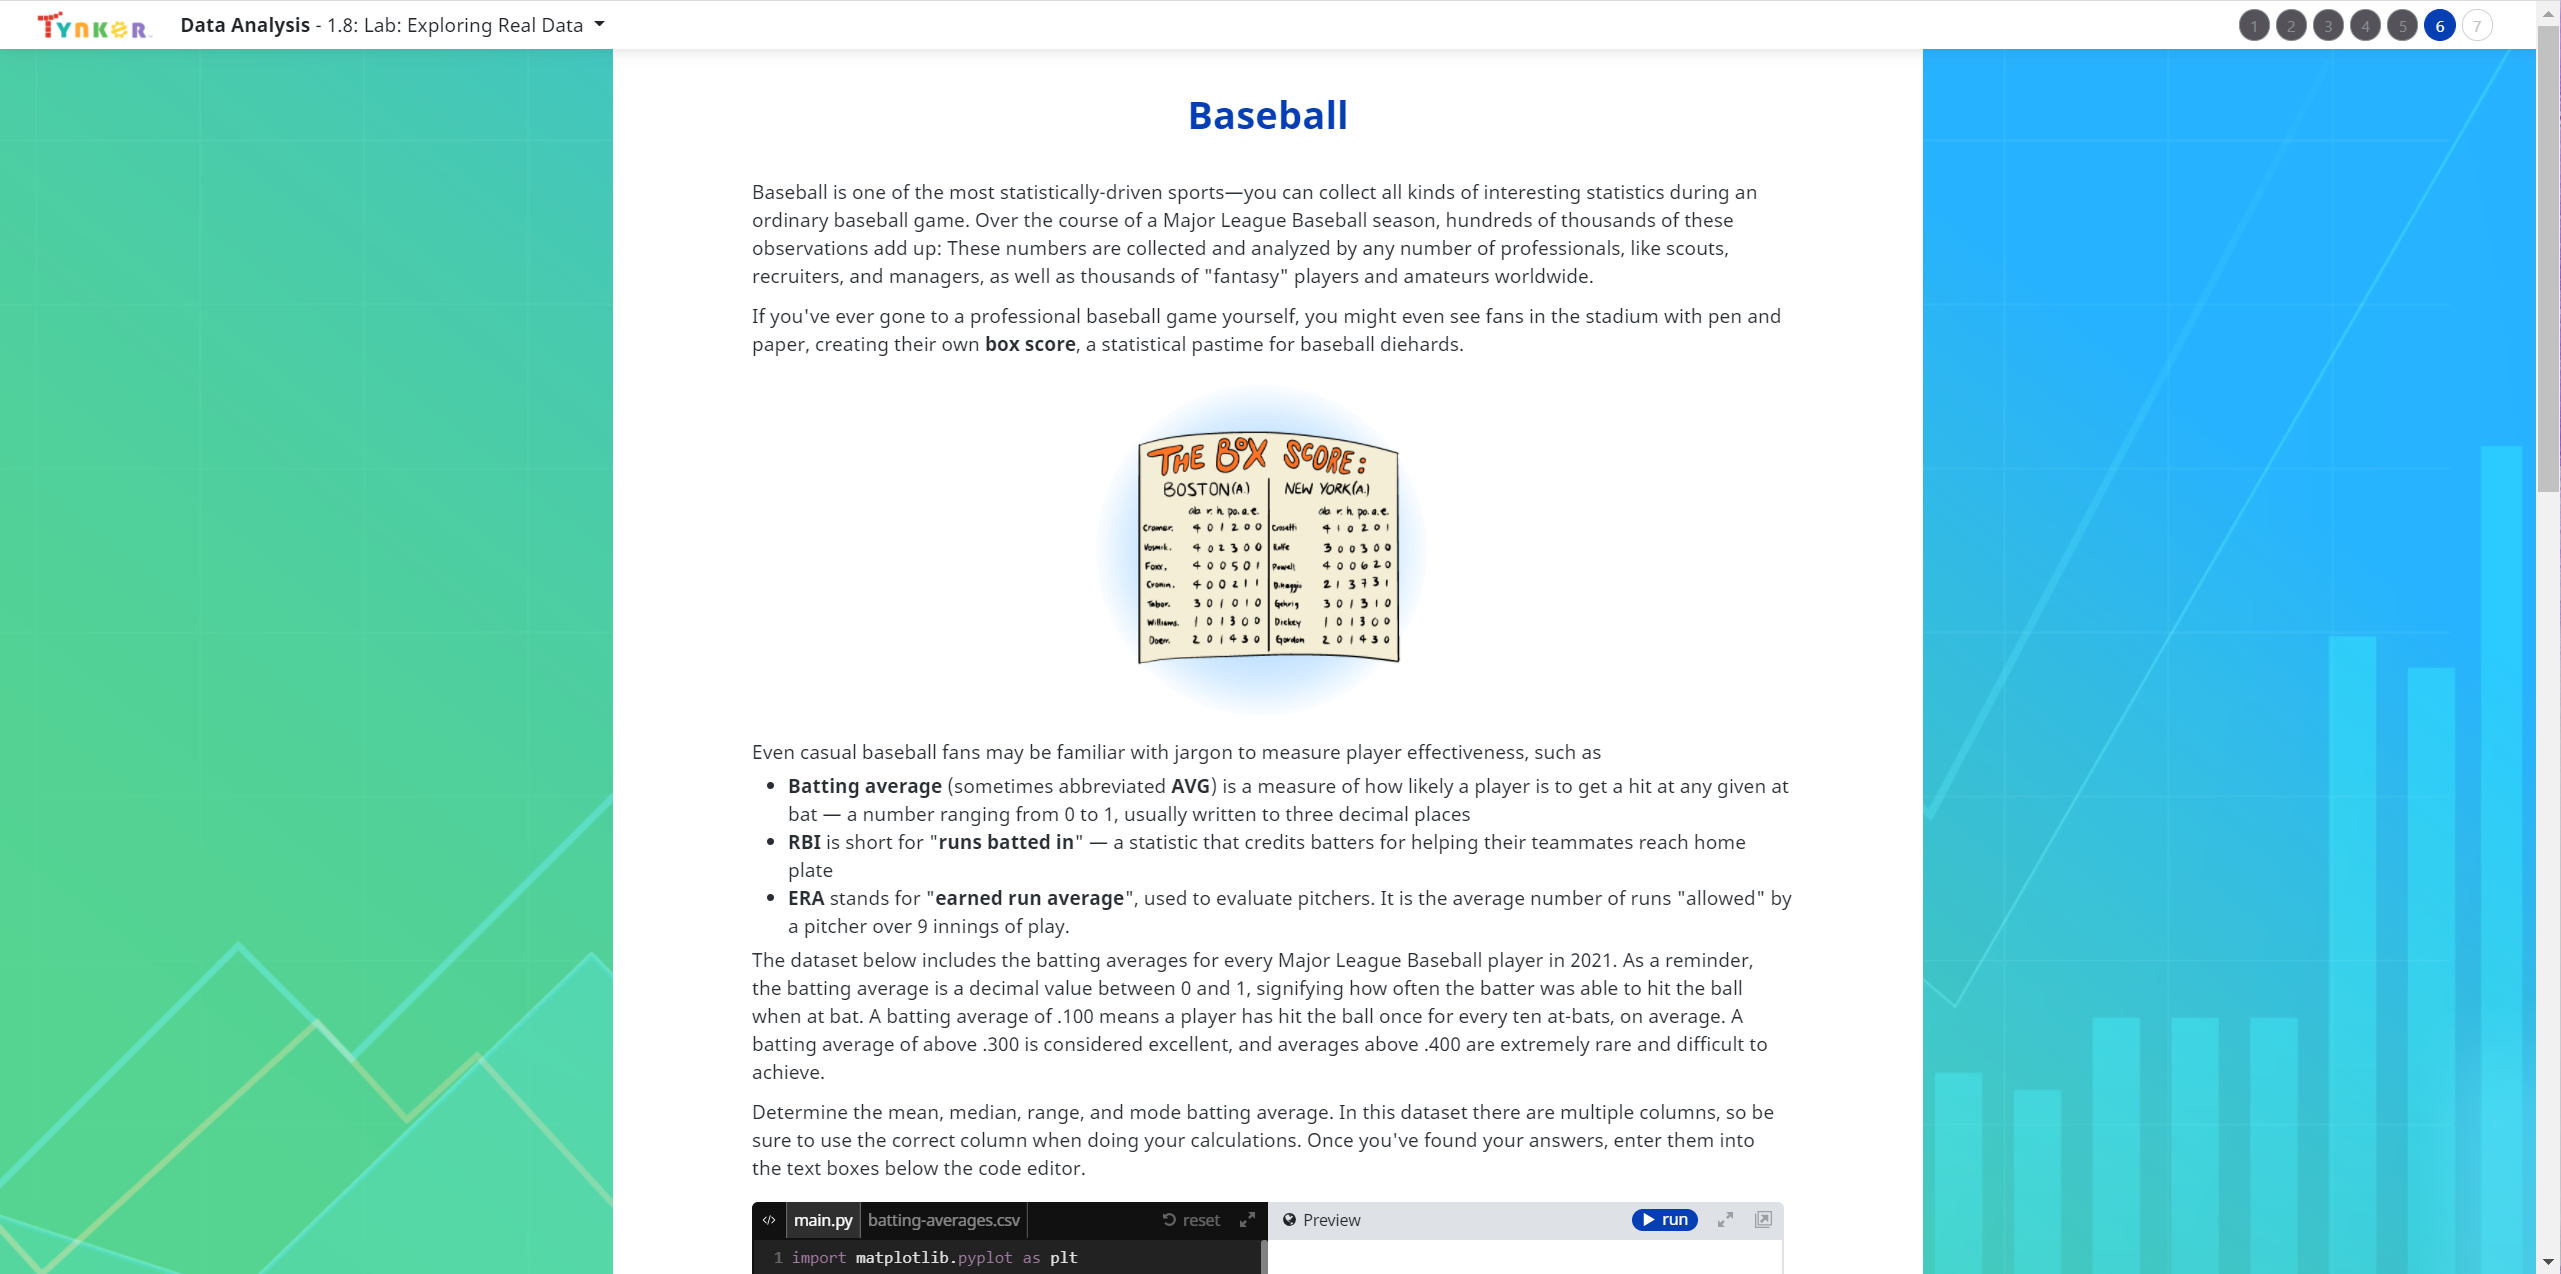
Data is everywhere around us, transforming our world. The applications are countless: the world of Moneyball and sports statistics, archeologists discovering hidden civilizations with LiDAR data, climate scientists tracking temperature change and polar ice melt—data science and our data-driven world are bringing exciting insights, discoveries, and analysis to bear in almost every field imaginable.
In this introductory course, students will learn how to interrogate a data set, just like a data pro, then make their own conclusions. Students will:
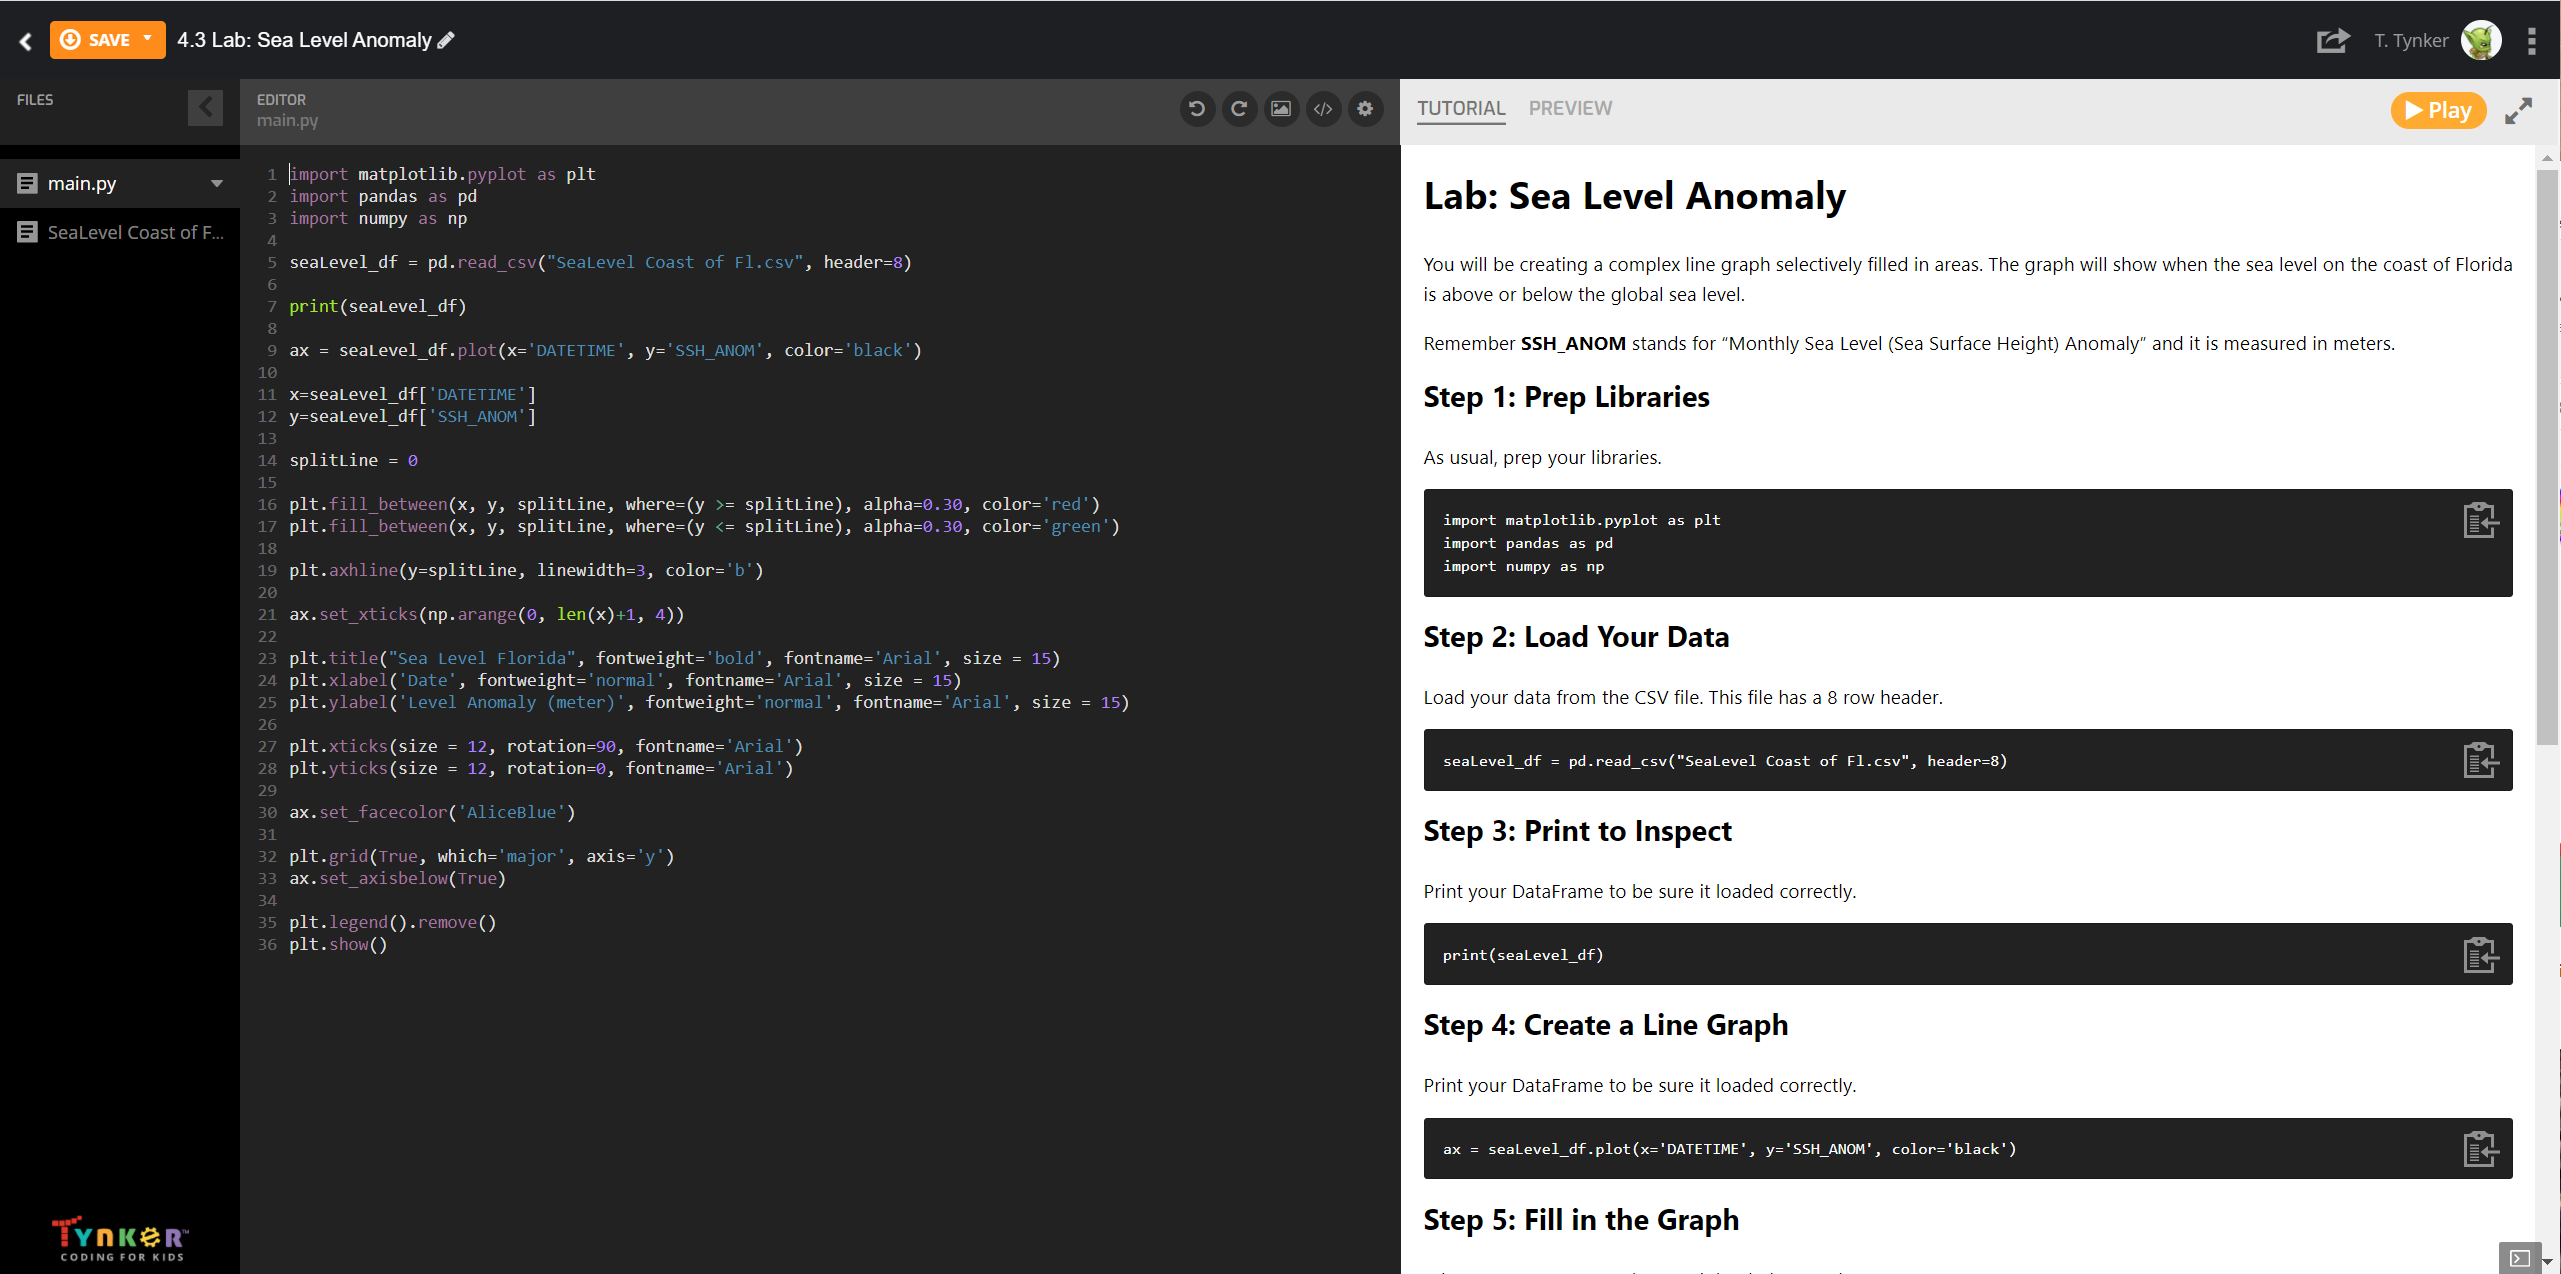
- Learn how to make use of Python, the most popular language for data science
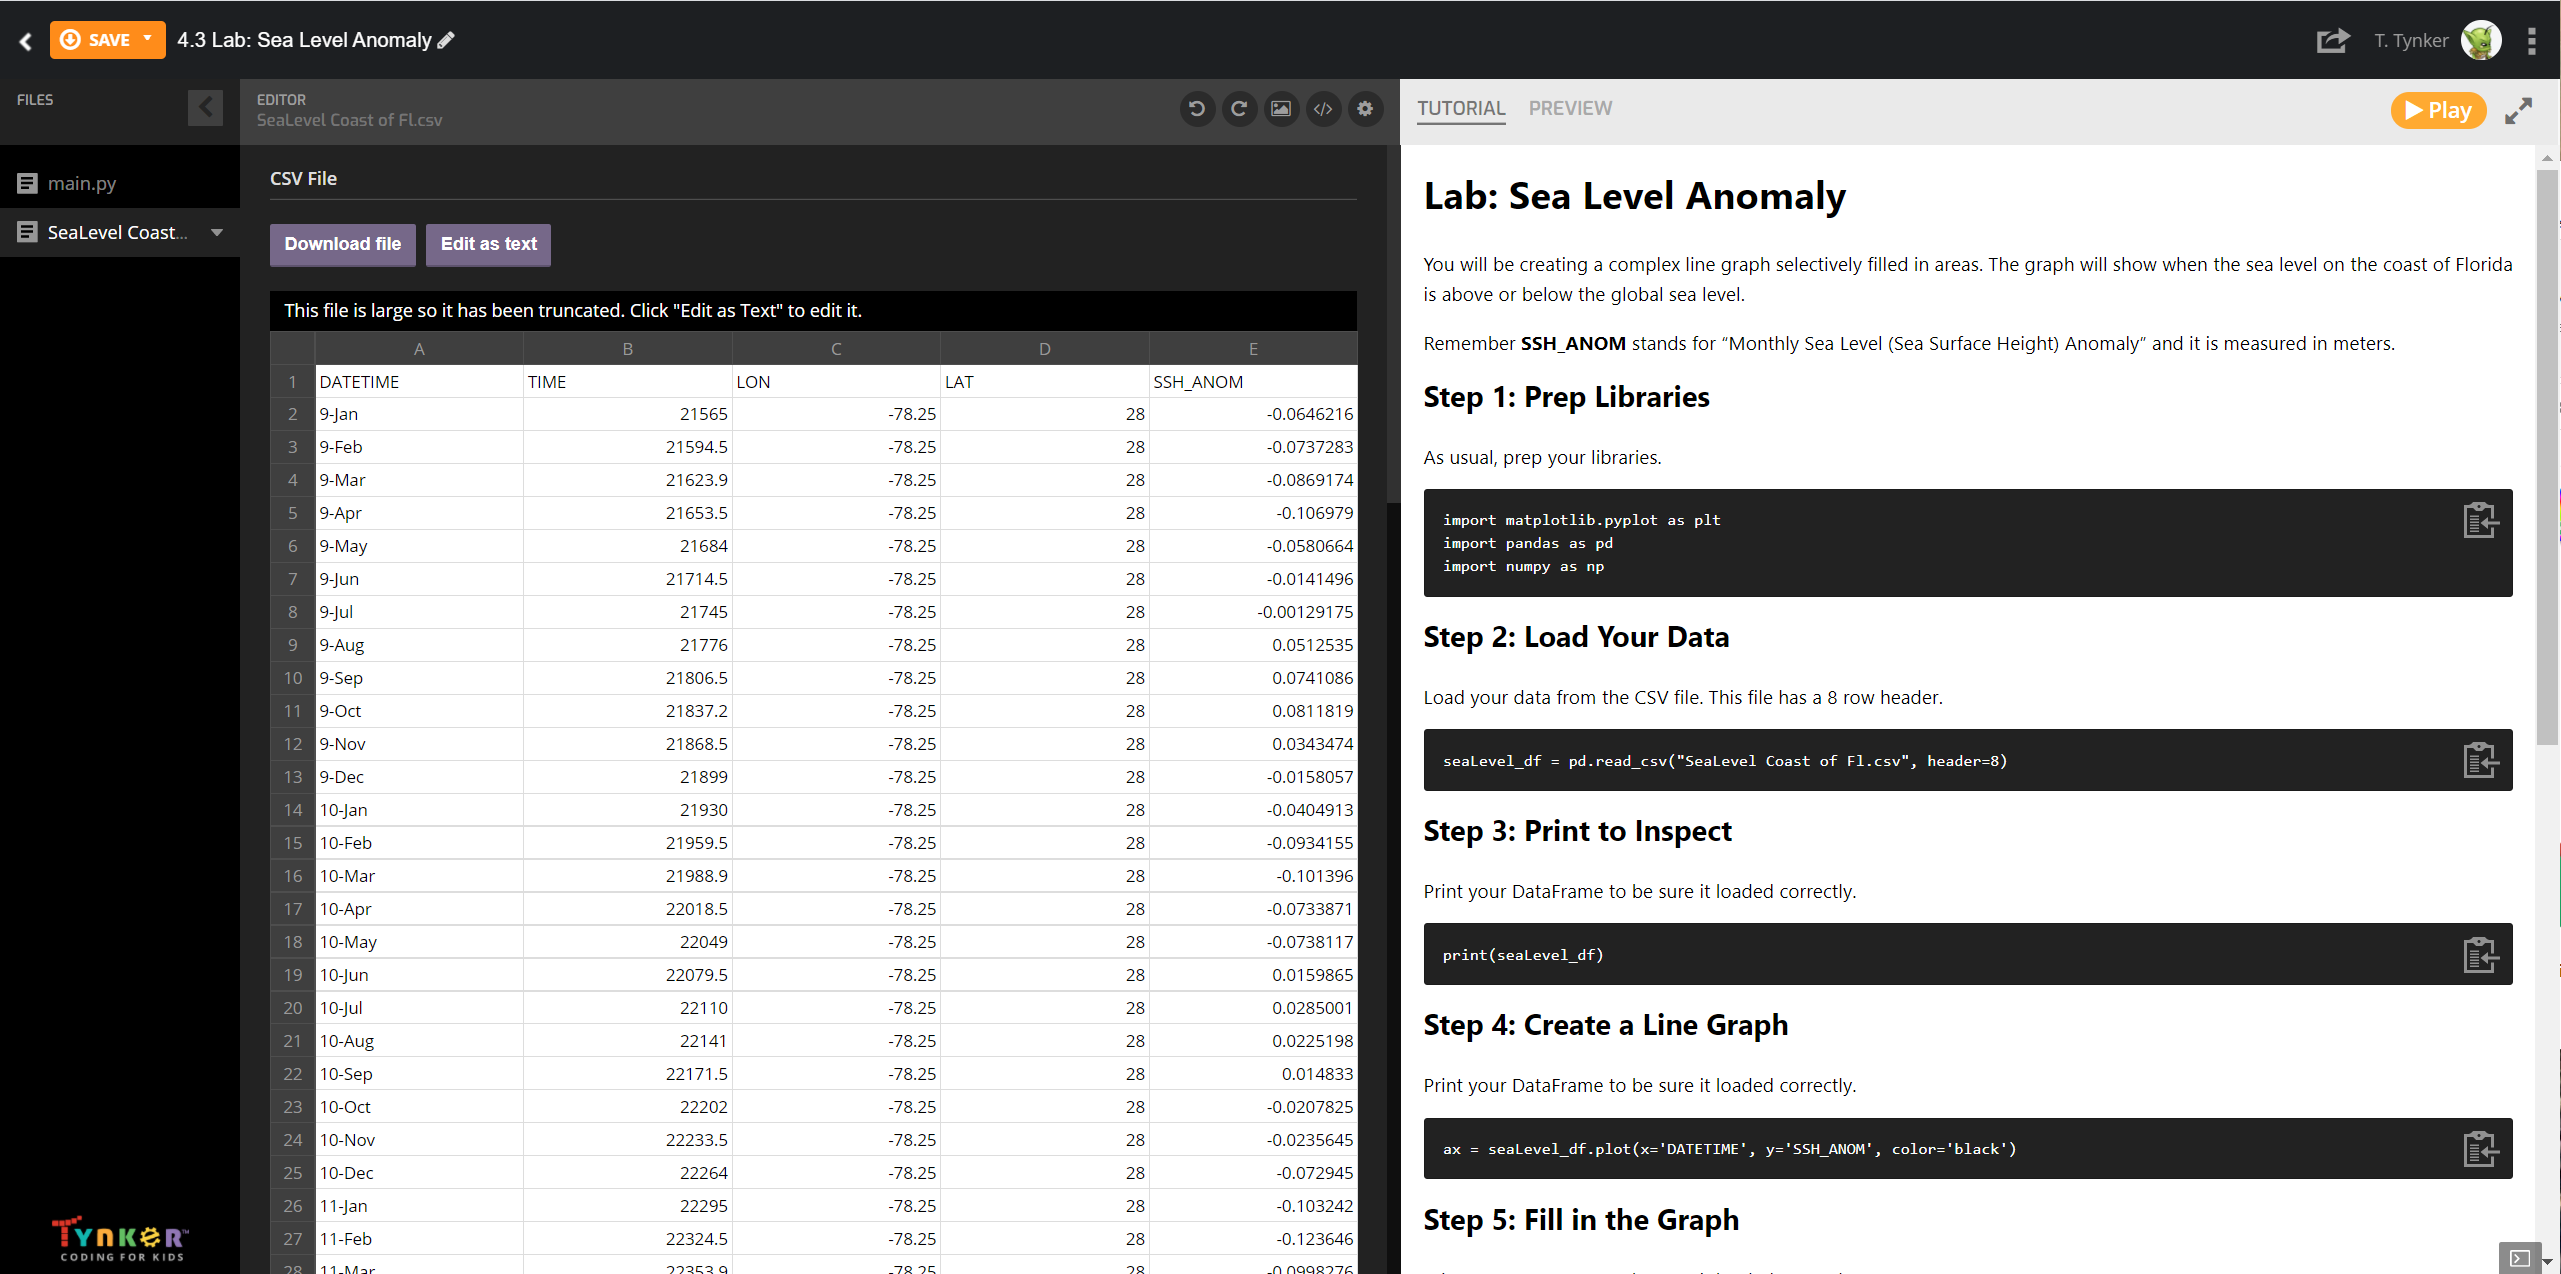
- Understand different types of data (categorical vs. numerical) as well as statistical analysis
- Model how things work, using data! Make a prediction, then test the results
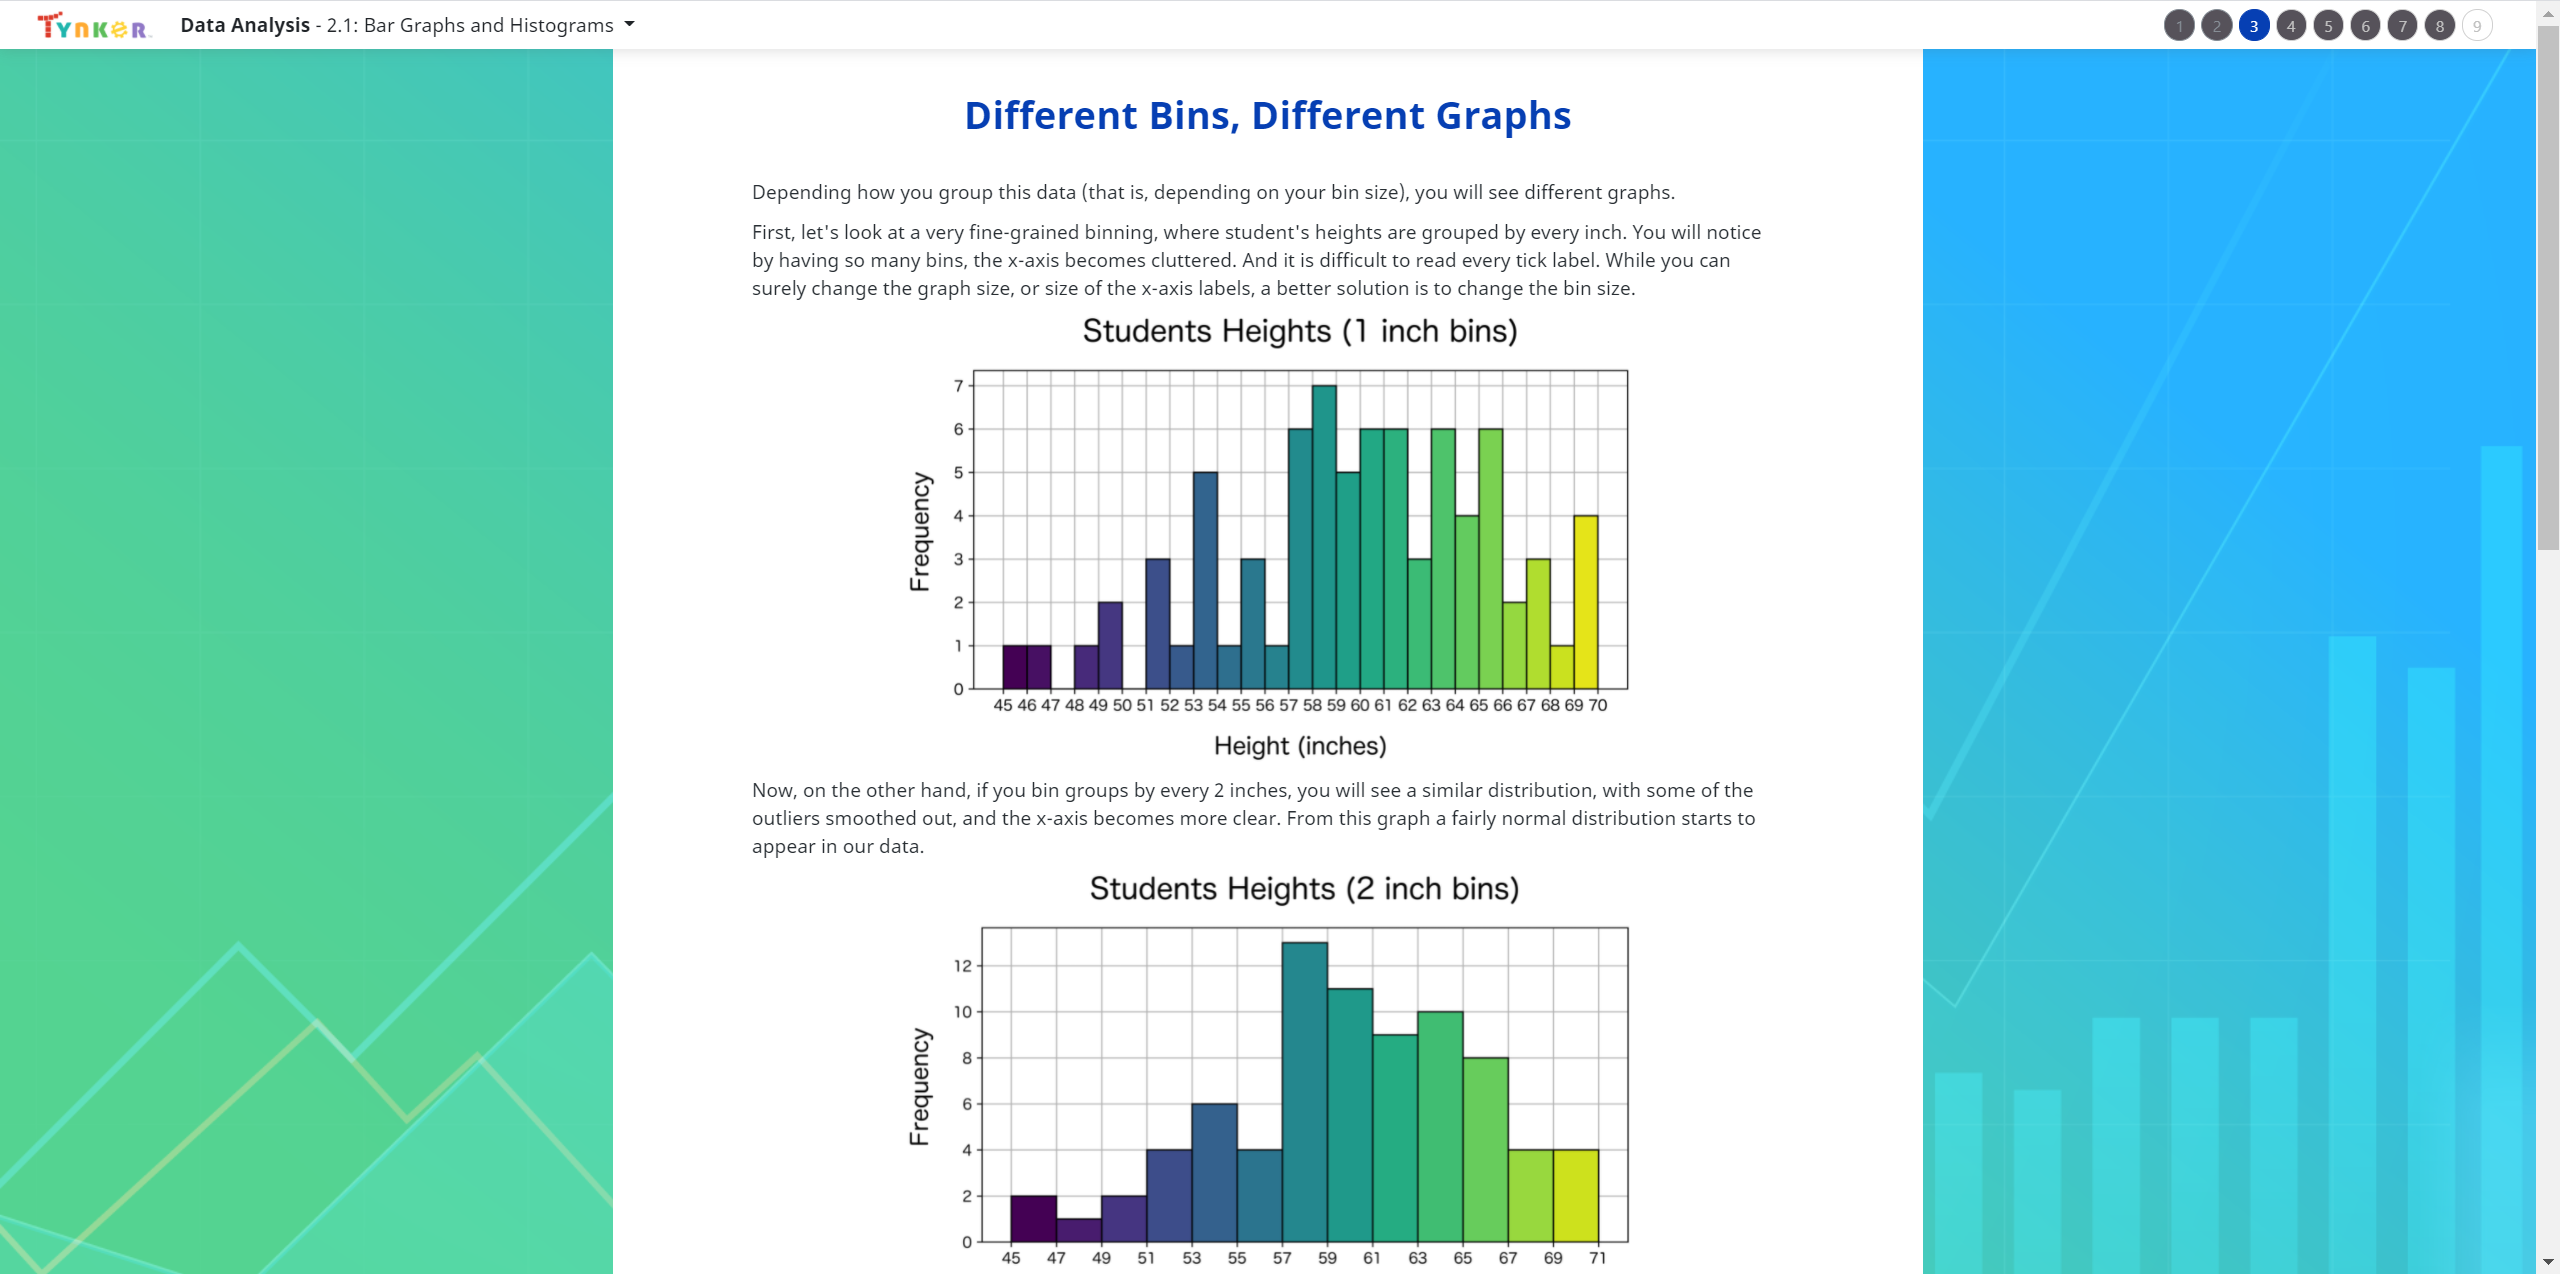
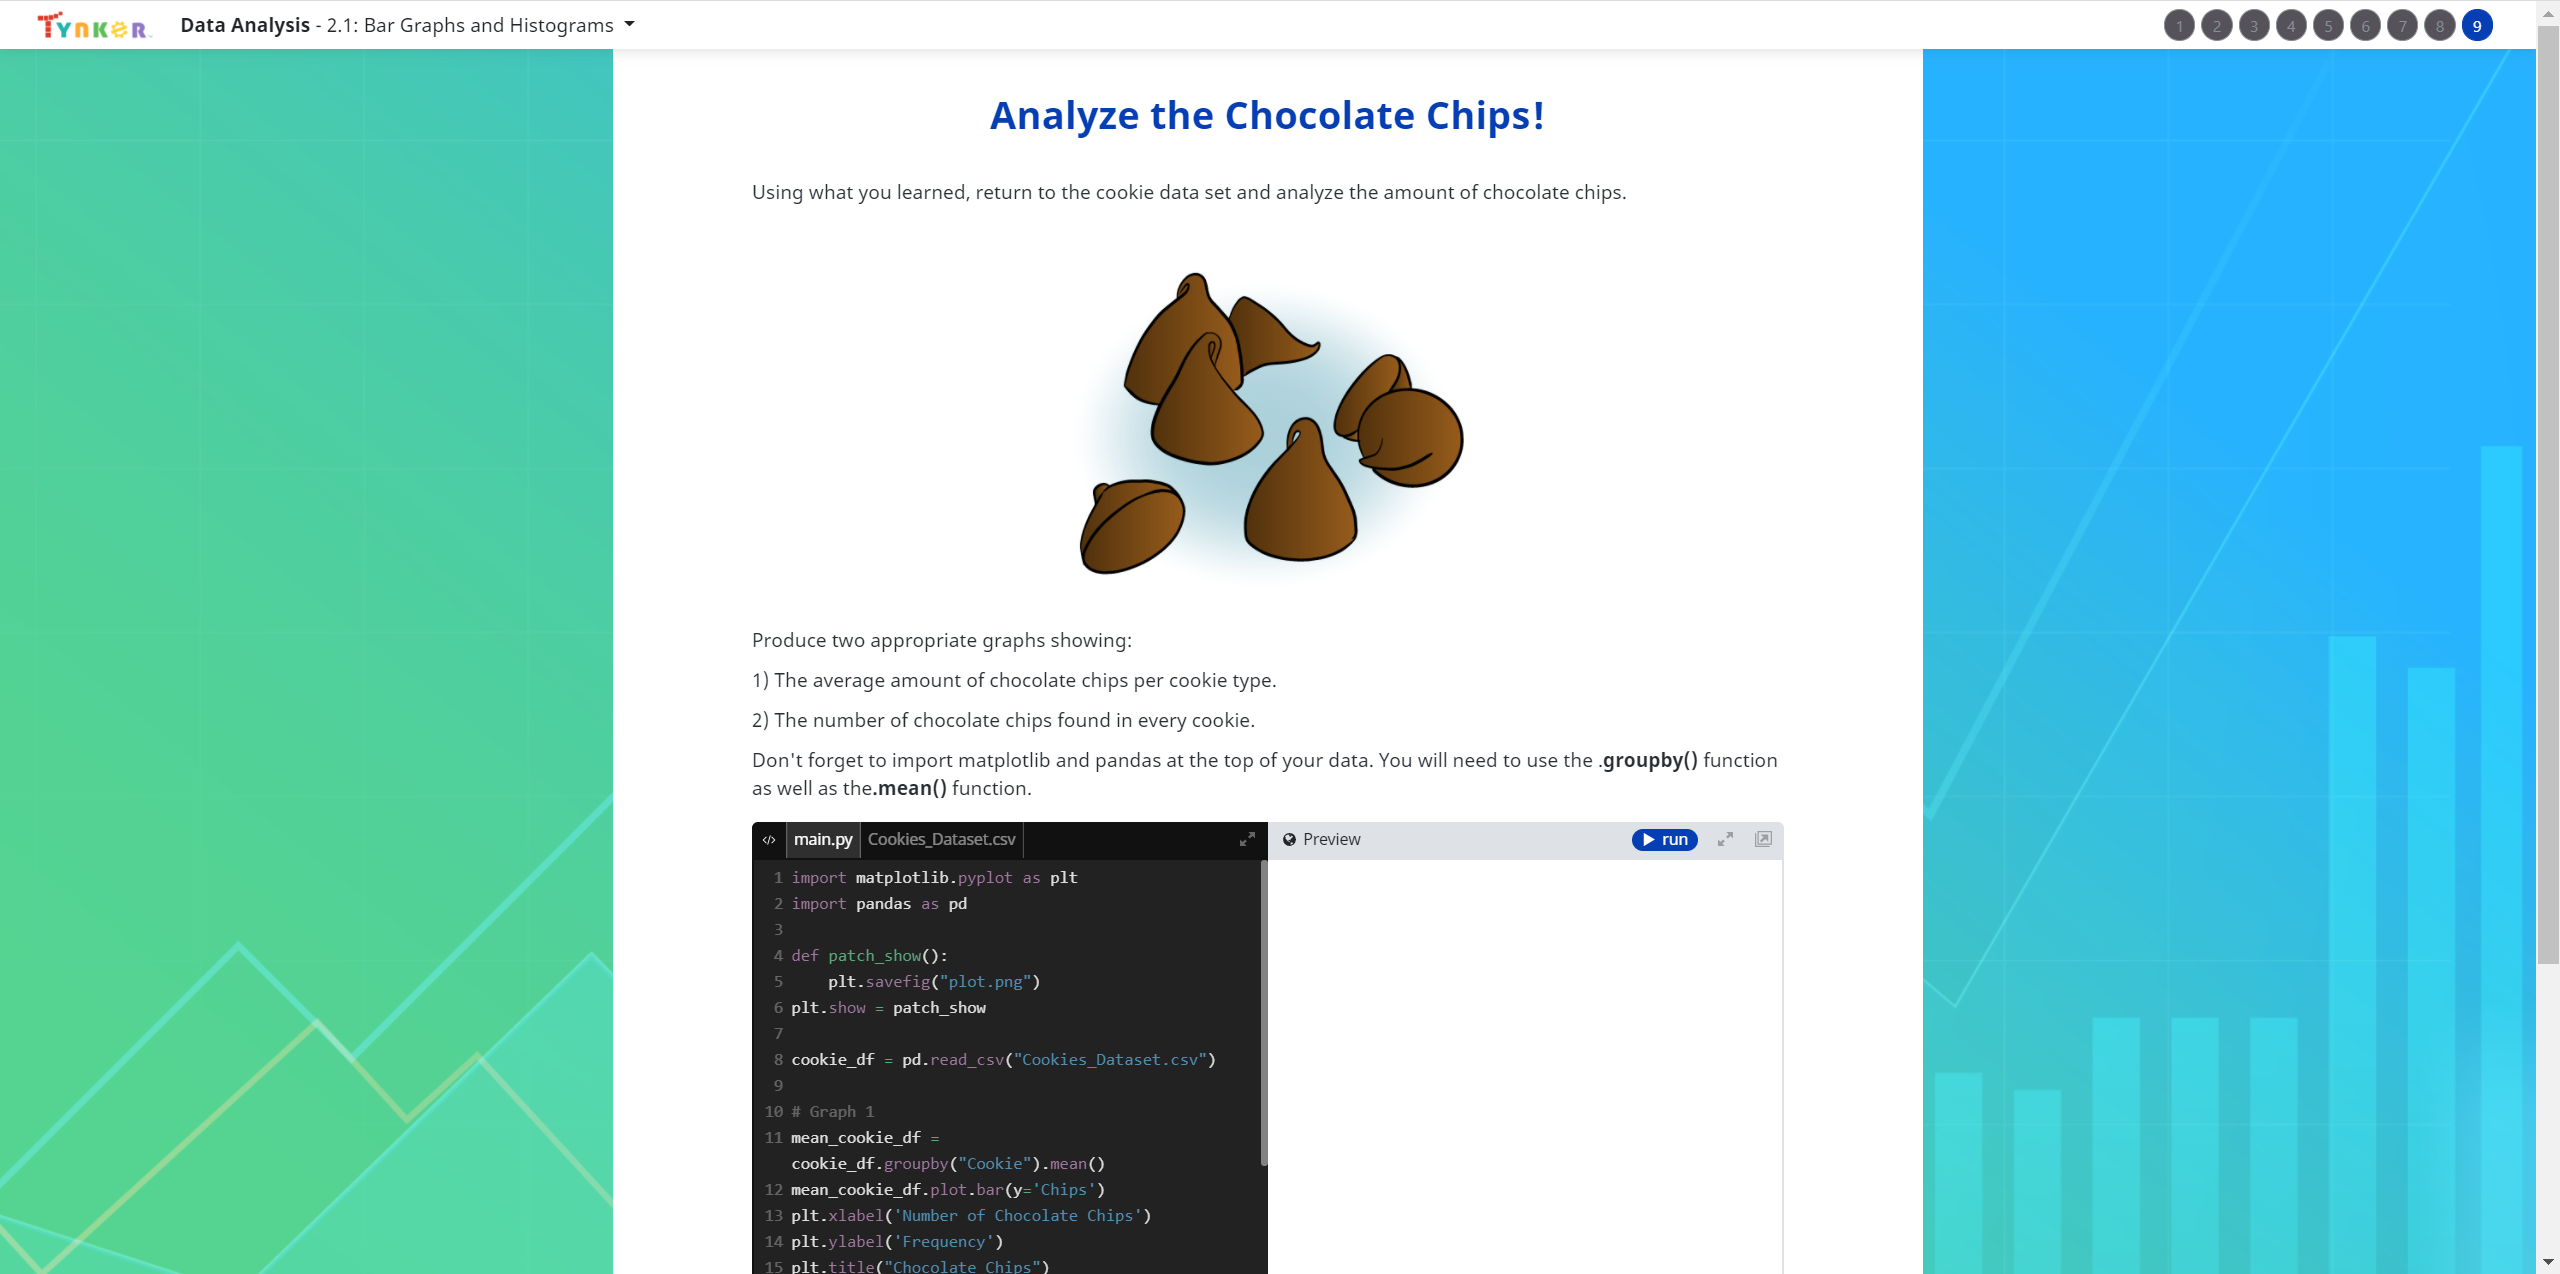
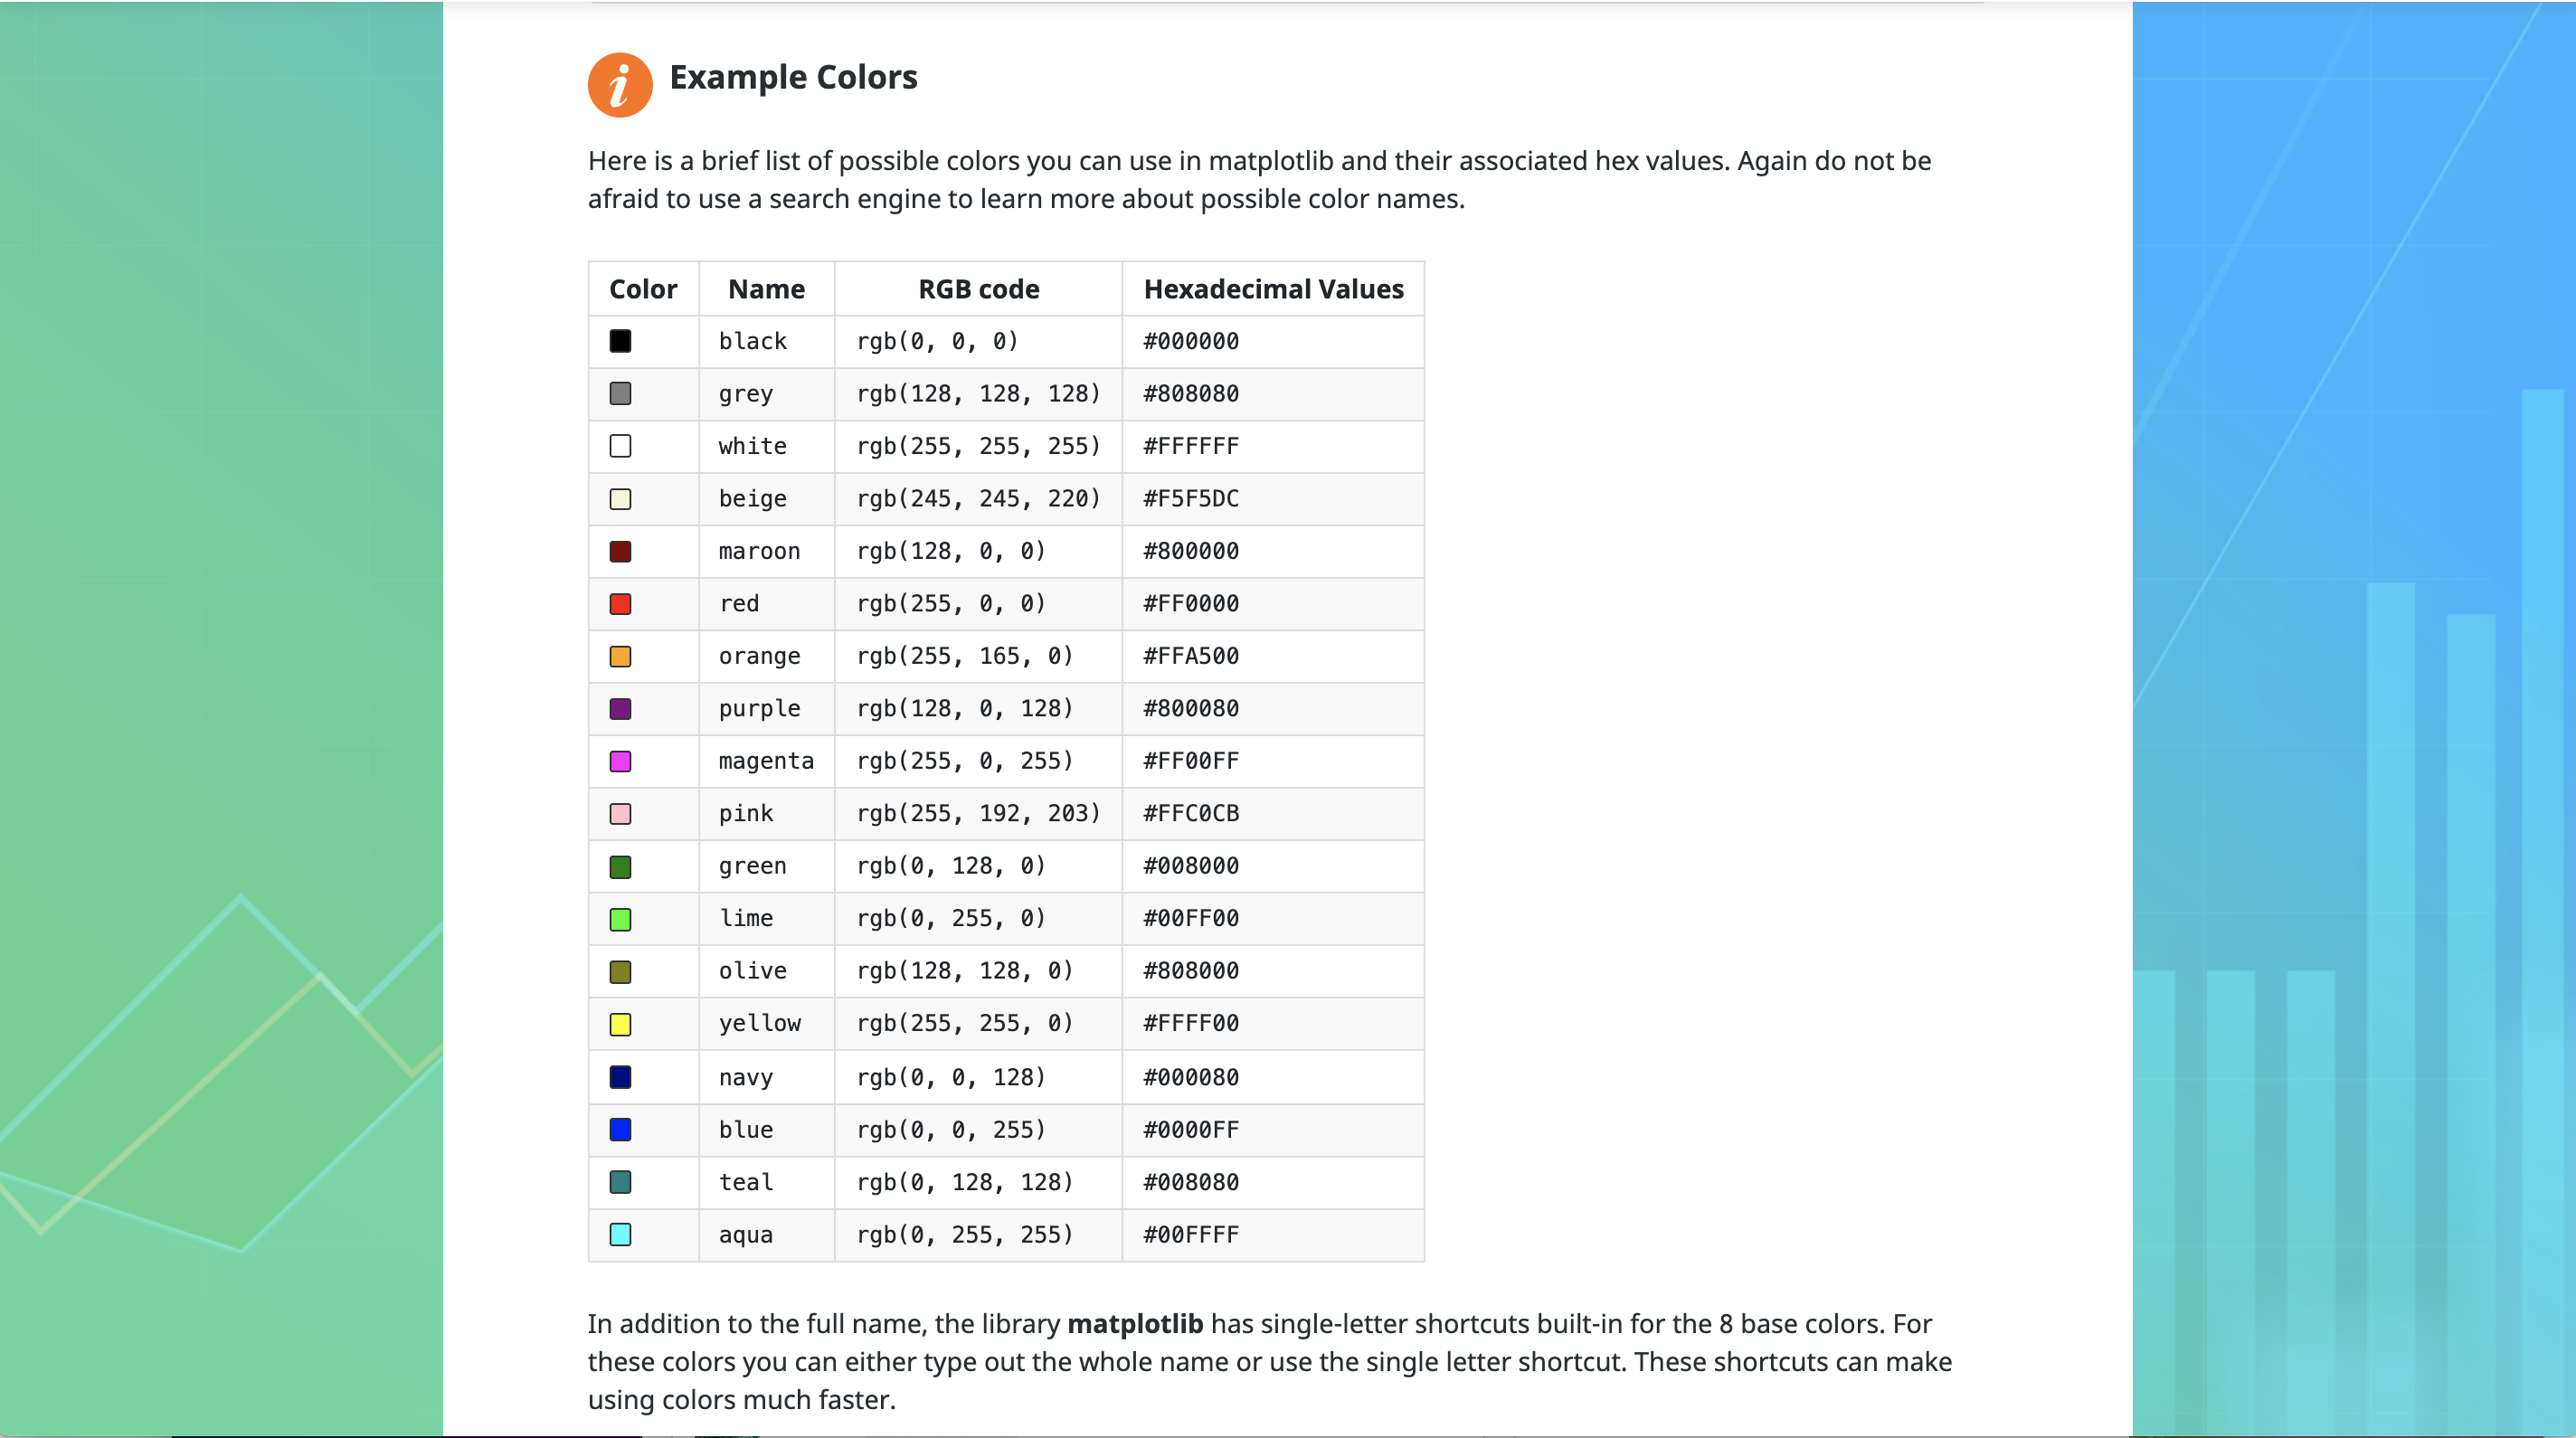
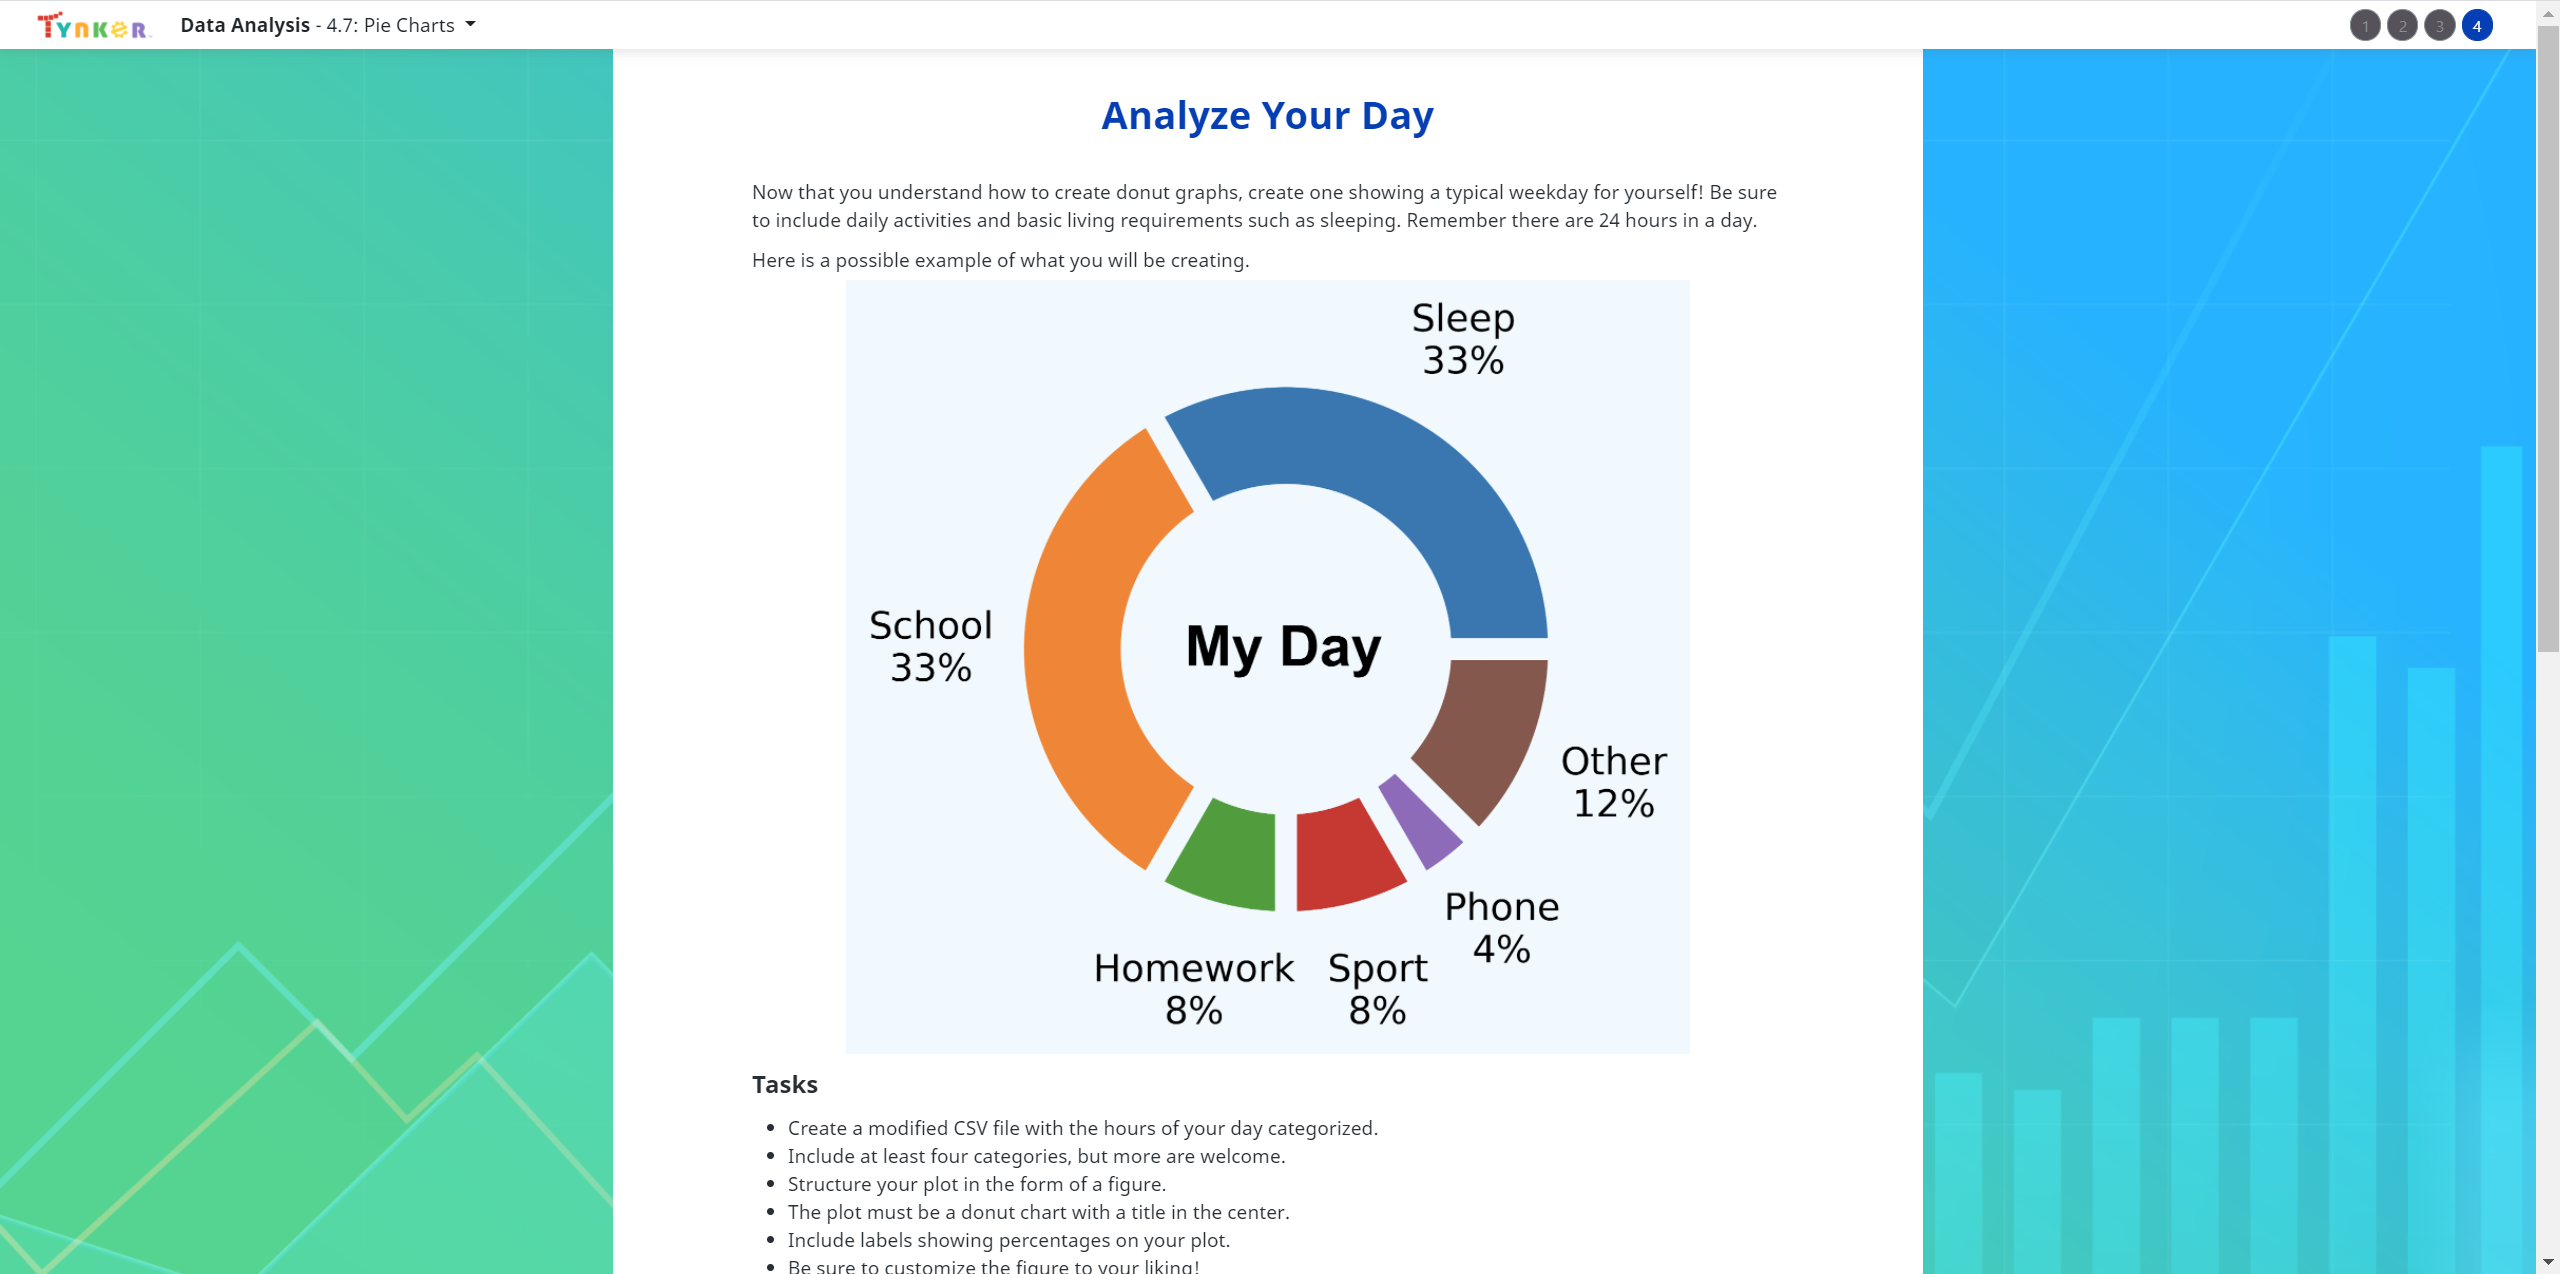
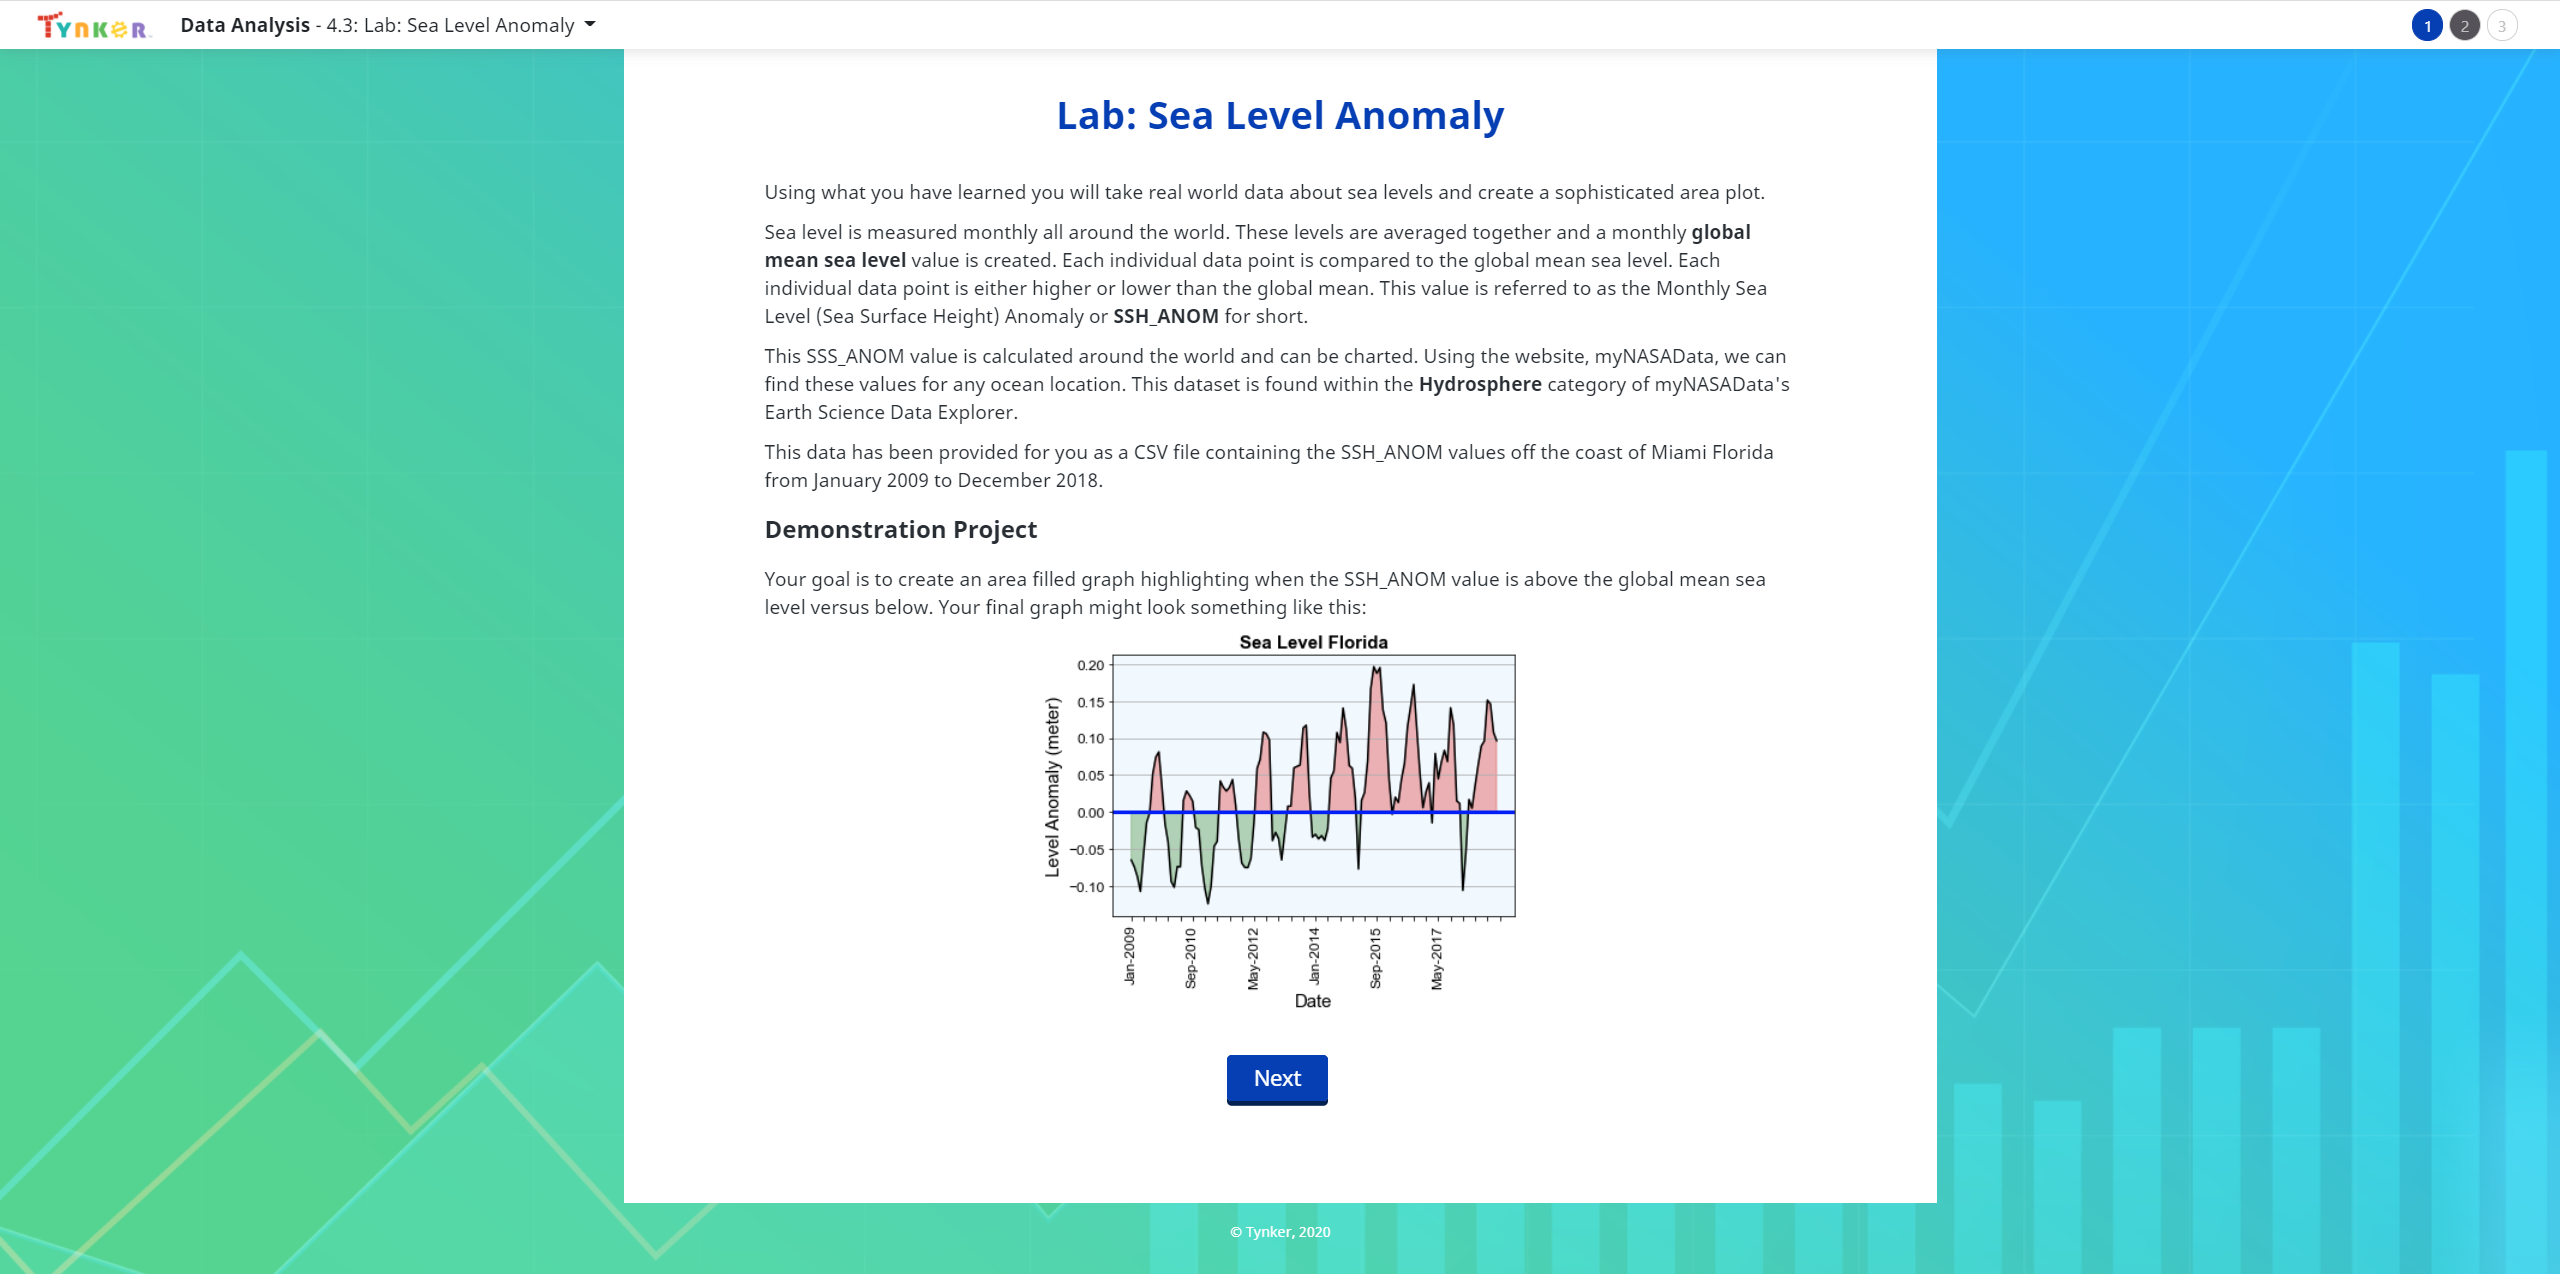
- Create their own, original graphs and visualizations
- Learn the strengths and weaknesses of different visualization types: And how to filter, clean, and interpret data
- Apply basic statistical concepts like mean, median, mode, and standard deviation
- Learn the industry-standard Data Science libraries: numpy, pandas, and matplotlib
Whether they're curious about data journalism, science, or just want to tell a story with data, this course is a fast and fun way to get started. Learn more about becoming a Data Scientist, sometimes called "America's Hottest Job," and explore a variety of real-world, hands-on labs.
Previous Python programming experience is recommended but not strictly necessary (complete Tynker's Python 101, or Tynker's AP CS Principles). The only prerequisite is Algebra 1.
Topics
- Python basics
- Loops
- Functions
- Expressions
- Operators
- Data types
- Variables
- Lists
- matplotlib
- numpy
- pandas
What Students Learn
- Analyze and Categorize Data
- Visualize Data with numpy, matplotlib, and Python
- Manipulate Datasets Using pandas
- Use Statistics
- Create Complex Charts and Figures
- Draw Conclusions
Technical Requirements
* Online courses require a modern desktop computer, laptop computer, Chromebook, or Netbook with Internet access and a Chrome (29+), Firefox (30+), Safari (7+), or Edge (20+) browser. No downloads required.
